Ethereum Price Analysis: Resistance Levels and Potential Breakout Ahead
Ethereum (ETH) trades above $1,625, facing resistance at $1,660 and $1,680. A possible breakout could lead to $1,690 and $1,750, while failure to surpass $1,660 may drop it to $1,610. Mixed market signals, including a MACD death cross and rising RSI, suggest caution among traders as the market awaits clearer directional movement.
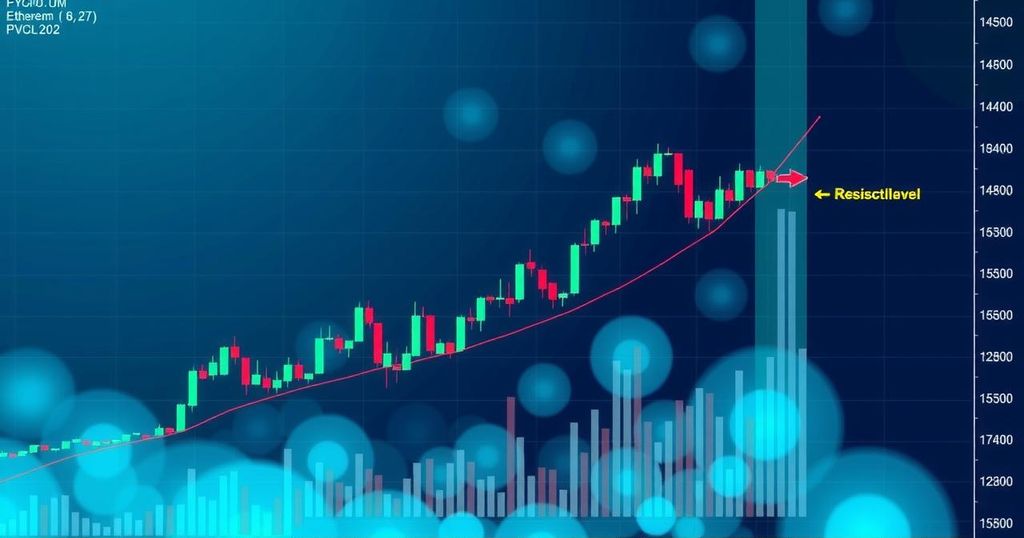
Ethereum (ETH) is currently trading above the $1,625 mark, buoyed by the 100-hour Simple Moving Average (SMA). It recently surpassed resistance levels at $1,600 and $1,620, peaking at $1,690 before experiencing a minor pullback. This analysis examines ETH’s recent price movement to predict potential future trends.
Currently, ETH is supported by an upward trend line at the $1,625 level. The 100-hour SMA aligns with this support zone, forming a robust foundation for price increases. However, immediate resistance is noted at $1,660, with a more formidable challenge at $1,680. A successful breakout above these levels could drive ETH towards $1,690 and perhaps $1,750.
Should ETH fail to breach the $1,660 barrier, the price could enter a decline. Key support is located at $1,620, with additional support extending from $1,620 to $1,610, where the 61.8% Fibonacci retracement sits. A drop below $1,610 may push Ethereum towards further support zones at $1,575 and $1,550.
Market indicators suggest cautious sentiment among traders. The ETH/USD hourly MACD shows divergence from bullish territory, while the RSI maintains a position above 50, indicating market neutrality. Traders await clear signals—either a breakout past resistance or a drop below support—to better predict forthcoming price actions. Bullish sentiment hinges on a successful breakout.
The 5-minute Ethereum/USDT chart on Binance highlights critical price levels that influence short-term directional changes. A brief surge to $1,670 resulted in a reversal due to resistance at this level. Following a sharp price drop after 11:30 UTC on the 14th, the MACD’s death cross confirmed bearish momentum, while the RSI approached oversold conditions, hinting at reduced selling pressure.
A “Golden Cross” formed on the MACD at 16:00 UTC, asserting that the recent price rally holds true strength rather than being a fleeting uptick. As of now, the RSI has transcended the 40-50 range, indicating a burgeoning bullish trend. Despite recent resistance challenges at $1,648, price movements showed investor support through a higher-low trendline observed between 04:30 and 06:30 UTC.
The future of Ethereum’s pricing significantly relies on whether it can break through the current resistance levels. The chart signals a pivotal moment where technical indicators align to confirm both support and resistance zones. Repeated price rejections at $1,648, coupled with rising lows, indicate potential breakout opportunities, although persistence below this mark may signal a reversal. Market participants must assess these movements to validate emerging trends effectively.


Post Comment