Ethereum Price Analysis: Whales Sell Off Amid Market Uncertainty
Ethereum’s price is currently $1,540, having dropped due to increased whale selling activity, erasing 4% of gains from a recent tariff pause announcement by Trump. Whales have significantly reduced their holdings, indicating market uncertainty and potential bearish momentum. Critical support is being tested at $1,500, where failure may lead to further declines towards historical support levels of $1,000-$1,100.
As of now, Ethereum (ETH) is priced at $1,540. The cryptocurrency has declined due to increasing selling activity from whales, resulting in erasing 4% of its previous gains attributed to the recent tariff pause announcement by former President Trump. The current situation indicates a struggle between bulls and bears as ETH approaches the $1,500 support level.
The recent rally in ETH, which gained over 11% on the tariff pause announcement, has been followed by a downturn, suggesting that the bullish sentiment may be a temporary phenomenon. The market remains cautious amidst macroeconomic uncertainties, especially with the Trump administration’s clarification regarding a 10% baseline tariff on all imports still being in effect.
On-chain analysis reveals that significant selling occurred recently as whales capitalised on the brief market rally. Notably, a key whale, who had bought ETH at $8, sold 10,702 ETH at $1,576 after two years, alongside other significant sell-offs leading to a five-month low in whale holdings between 10K and 100K ETH, which now stand at 24.66 million ETH.
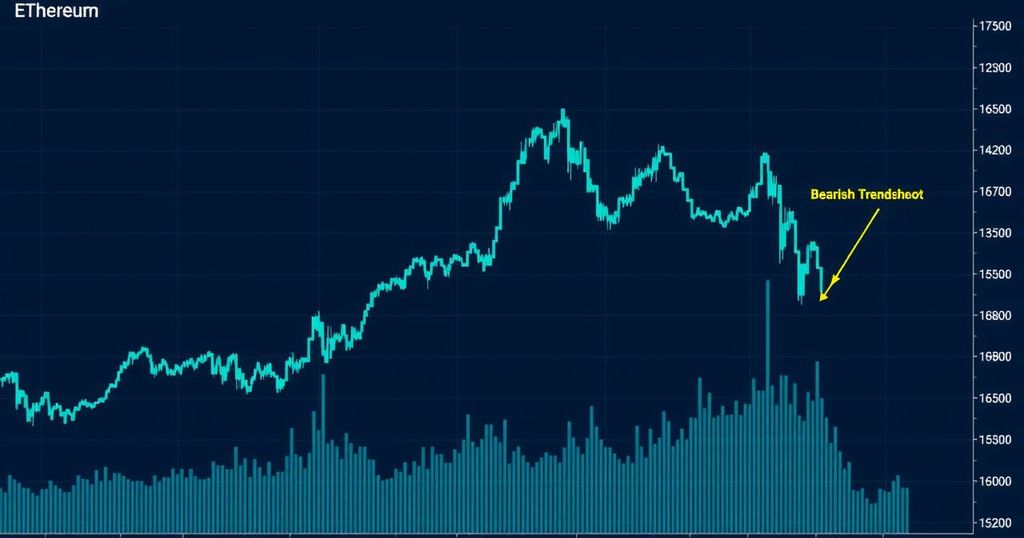
Data indicates that bearish momentum is affecting Ethereum significantly, as seen in the recent $88.75 million in futures liquidations, comprising $66.64 million in long liquidations and $24.11 million in short liquidations. Ethereum’s price drop to $1,540 from a high of $1,682 signifies a critical juncture where bulls must hold the $1,522 support, or face further declines.
Should the support fail, Ethereum might drop towards critical levels around $1,000 to $1,100, a significant range historically linked to past market collapses. Technical indicators like the Relative Strength Index (RSI) and Moving Average Convergence Divergence (MACD) are exhibiting heightened bearish signals, complicating ETH’s recovery prospects. A weekly close above the channel’s upper boundary would refute the current downward trend analysis.


Post Comment