Bitcoin Price Analysis: Potential Decline Signals Eyed
Bitcoin’s price is experiencing a decline from $86,500, currently consolidating below $85,000. It has broken below key support levels, indicating potential further declines. The next major support is at $83,200, while resistance levels sit at $84,500 and $84,750. The hourly MACD and RSI suggest a bearish market trend.
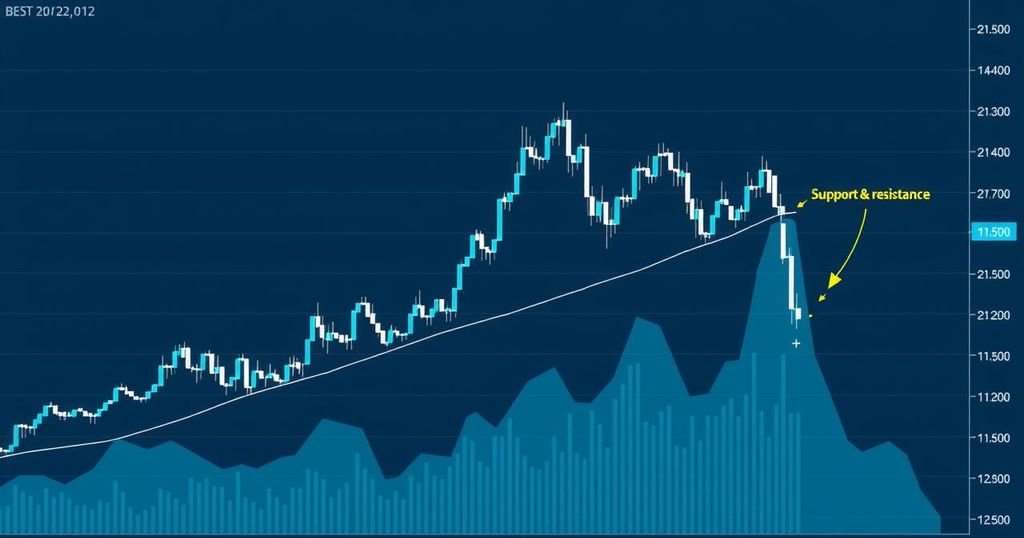
Bitcoin’s price has initiated a decline from the $86,500 level. Currently, it is consolidating its losses and may drop further below the support at $83,200. The cryptocurrency is trading under $85,000 and below the 100-hourly Simple Moving Average. Notably, a break has been observed below a significant bullish trend line, which had support around $84,500, as per the BTC/USD hourly chart from Kraken.
Previously, Bitcoin increased past the $83,500 mark, gaining momentum above the $84,000 and $85,500 resistance levels. It surmounted the $86,000 mark, peaking at $86,401, before recently retreating. The price has fallen below the $85,000 support, currently testing the $83,200 support level. Bitcoin’s current trading state is below $85,000, indicating market resistance near the $84,000 level and the 23.6% Fibonacci retracement of the recent decline.
Key resistance levels for Bitcoin are marked at $84,500 and $84,750. Should the price overcome the $84,750 resistance, it may continue to rise, potentially testing the $85,500 resistance, while sustained gains could lead to a level near $86,400. Conversely, if Bitcoin does not break through the $85,000 resistance, a further decline is likely.
The immediate support level is at $83,500, with the first major support situated at $83,200. Additional support levels include $82,200 and $81,500, while the primary support lies at $80,800. Technical indicators are showing that the hourly MACD is gaining momentum in a bearish trend. Additionally, the Relative Strength Index (RSI) for BTC/USD is currently beneath the 50 mark, reflecting bearish sentiment in the market.


Post Comment