Ethereum Price Analysis: Bullish Pattern Suggests 35% Surge Opportunity
Ethereum’s current price is $1,580, with a rise of 14% this month but facing downward pressure from ETF outflows and competition. Significant outflows from Ethereum ETFs, up to $2.24 billion, indicate reduced investor engagement. Despite a bearish trend, a bullish divergence and falling wedge formation suggest a potential for a 35% price increase, targeting $2,140.
Ethereum’s price remained stable this week at $1,580, marking a 14% rise from its lowest point this month despite the prevailing market challenges. The stagnation is attributed to investor caution and increased outflows from exchange-traded funds (ETFs). Meanwhile, Ethereum faces heightened competition from layer-2 networks like Base and Arbitrum, in addition to competing layer-1 networks such as Sui and Solana that continue to expand their market presence in sectors like decentralised finance (DeFi) and gaming.
Ethereum’s spot ETFs have seen significant asset outflows, totalling $2.24 billion over eight consecutive weeks, indicating a lack of investor traction. On a concerning note, many Ethereum investors have begun selling their assets at a loss, which is reflected in the negative Network Realized Profit/Loss metric, highlighting the ongoing difficulties in the market.
Technical analysis of Ethereum’s price action reveals a strong bearish trend since peaking at $4,100 last year, with current trading below the 50-day and 200-day Exponential Moving Averages and critical support at $2,140. This support level is vital as it coincides with the neckline of a triple-top pattern observed on the weekly chart.
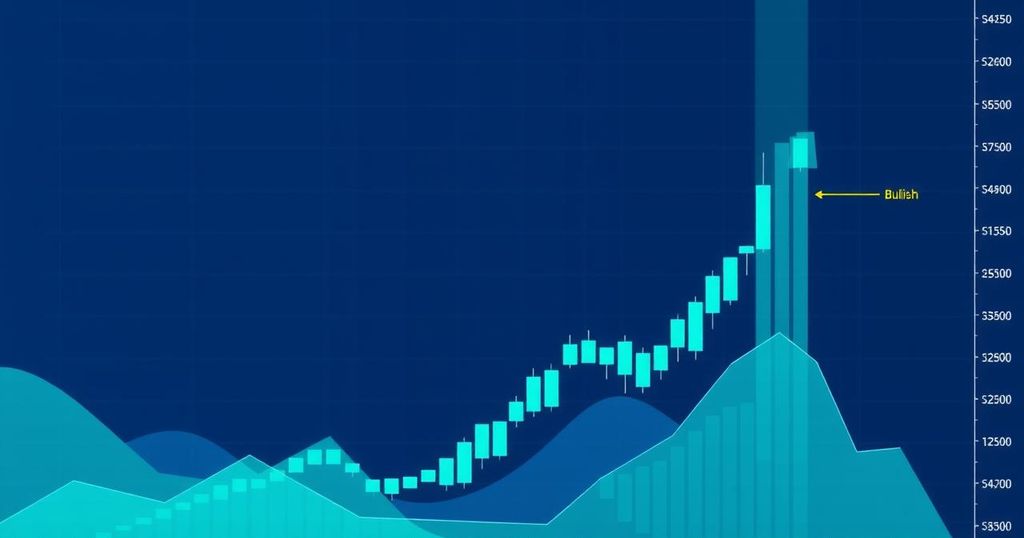
Conversely, a bullish divergence pattern has emerged, indicated by the rising lines of the MACD, coupled with the Relative Strength Index surpassing a declining trendline. Additionally, Ethereum has constructed a large falling wedge formation, marked by two converging downward trendlines. The convergence suggests a potential bullish breakout, with an imminent target of $2,140, representing a possible 35% increase from the current price.


Post Comment