Ethereum Transaction Fees Hit Five-Year Low: Implications for Price Movement
Ethereum’s average transaction fees have dropped to a historic low of $0.168, indicating reduced network activity. Such periods of low fees may presage price rebounds, as demonstrated by past trends where ETH rebounded following similar fee levels. Currently, ETH is trading at approximately $1,600. However, there are no fixed indicators for market bottoms or tops based solely on fee metrics.
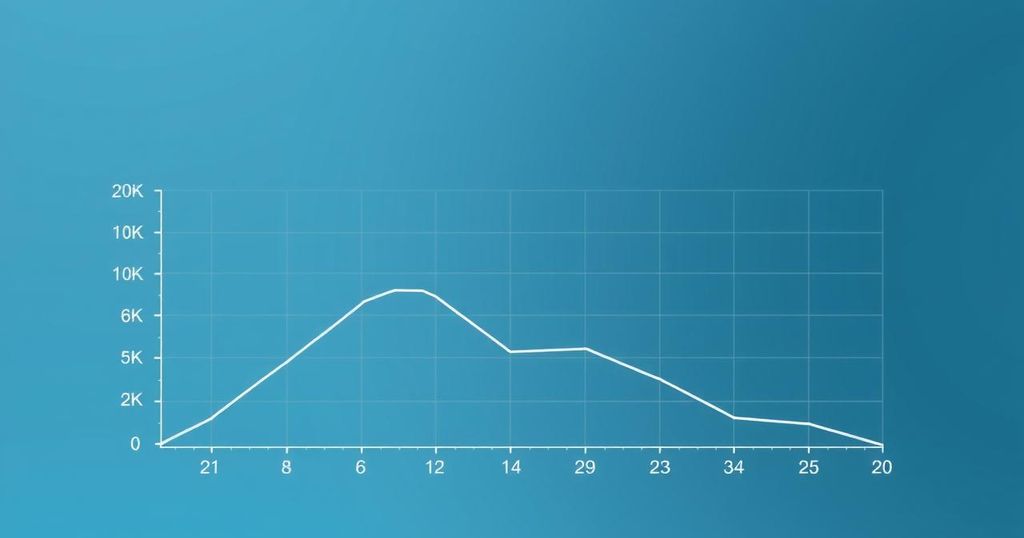
Recent analysis by Santiment reveals that Ethereum transaction fees have plummeted to a five-year low of just $0.168. This metric represents the average fees users attach to transactions on the Ethereum network, directly reflecting the blockchain’s activity level. Low fees suggest minimal network congestion; conversely, high fees indicate robust traffic as users compete to prioritise their transactions for validation.
The recent decline in the average fees demonstrates that activity on the Ethereum network is at a historic low. While surges in fees typically occur during busy periods, the current low fees may signal a lack of interest among users. Historically, such low fee periods can precede price rebounds, implying potential bullish momentum ahead for ETH.
Historical data indicates that whenever the Ethereum Average Fees dipped below $1, the asset typically experienced price rebounds. For instance, in 2023, fees below this threshold preceded a bullish phase for ETH. This behaviour may stem from market dynamics, where pessimism leads to price increases, contrasting with periods of hype which often culminate in price peaks.
At present, Ethereum is trading around $1,600, having increased by over 1% in the last 24 hours. Despite the fluctuating fees, the asset’s price remains relatively stable in the current market conditions, reflecting investor sentiment and network activity.
It is essential to acknowledge that while low average fees could indicate a buying opportunity, there are no definitive bottom or top levels regarding fee dynamics. Therefore, caution is advised when interpreting these trends in isolation.


Post Comment