Ethereum’s Price Struggles: Key Support and Resistance Levels Explored
Ethereum’s price faces resistance above $1,600, struggling to gain momentum after a decline. Key levels to watch include support at $1,540 and resistance at $1,655. Technical indicators suggest a bearish trend, with potential recovery only if $1,615 is cleared. Current price fluctuations indicate volatility, with possible future targets at $1,750 or $1,800 if upward momentum materialises.
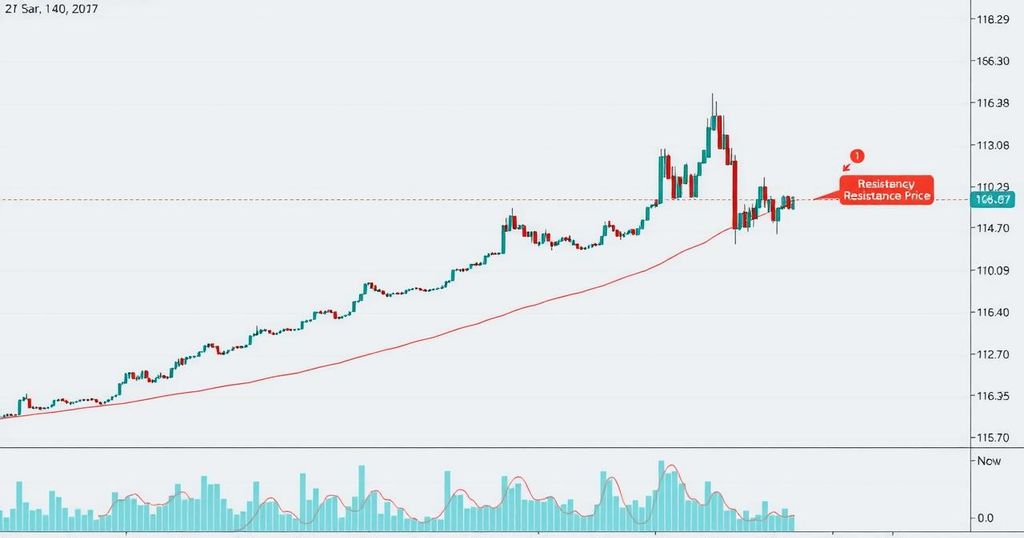
Ethereum’s recent price movements show a decline from the $1,620 and $1,600 levels, indicating a consolidation phase. The currency is presently trading below the 100-hourly Simple Moving Average, which typically signals a bearish trend. A minor breakout occurred above a bearish trend line at $1,590 on the hourly chart of ETH/USD, potentially setting the stage for further price action if the $1,615 resistance is breached.
After struggling to maintain upward momentum past $1,690, Ethereum fell below critical support levels of $1,600 and $1,580, with a notable dip below $1,550. A local low of $1,538 was established, followed by a recovery attempt as the price reclaimed value above $1,580, crossing the 23.6% Fibonacci retracement of the prior downward move from $1,690 to $1,538. Despite these gains, Ethereum continues to face significant resistance around the $1,600 mark and must push through $1,615 to advance.
If the price manages to rise above $1,655, it may target the $1,700 resistance zone, which would open the door for potential future gains, possibly reaching $1,750 or even $1,800. Conversely, if Ethereum cannot overcome the $1,615 resistance, it runs the risk of declining further, with initial support at $1,575. Key support levels to watch are $1,540, $1,480, and $1,400.
Technical indicators such as the hourly MACD suggest diminishing bearish momentum, while the RSI remains below the neutral zone at 50, indicating a potentially bearish outlook. The major support and resistance levels identified are $1,540 and $1,655, respectively.


Post Comment