Ethereum Approaches Final Bottom as Price Hits Key Support Levels
Ethereum’s recent drop of 65% raises concerns about potential market bottom signs. Past fractal patterns from 2018 and 2022 indicate similar price actions leading to significant bearish phases. Key price targets are set around $1,000. Additionally, Ethereum’s Net Unrealized Profit/Loss is in a capitulation phase, hinting at historical bottoming signals.
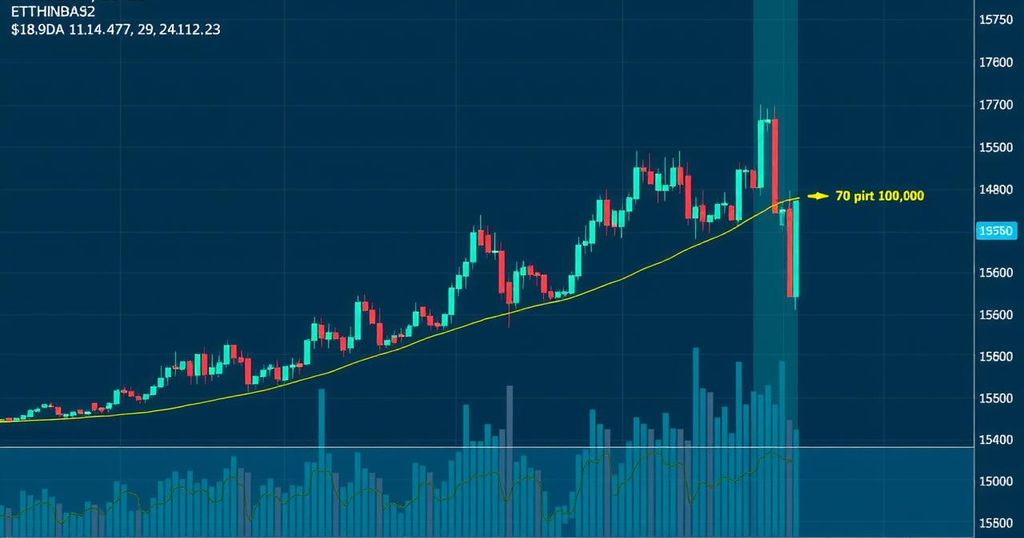
Ethereum’s price is exhibiting signs of bullish exhaustion, following a dramatic 65% decline over the past three months. This steep downturn, coupled with various price metrics indicating oversold conditions, has raised questions among investors about a potential market bottom. Analysts are scrutinising these trends closely, as it seems that we could be nearing a critical juncture in ETH valuation.
Currently, Ether’s price movement resembles fractal patterns observed in 2018 and 2022, where dramatic rallies were succeeded by sharp declines and extended bear phases. Significantly, during these past cycles, higher price peaks were met with lower highs on the relative strength index (RSI), showcasing a classic bearish divergence signaling weakening market strength. These conditions often lead to market corrections, which the current ETH setup suggests may also be in its final stages.
In December 2024, ETH reached a high of around $4,095, although the RSI painted a different picture with its lower high. This indicated the onset of a correction similar to that of previous years. Now, with ETH below the 1.0 Fibonacci retracement level at $1,550 and the weekly RSI still above the significant oversold threshold of 30, there appears to be room for further declines. Analysts are eyeing a price target of somewhere between $990 and $1,240, particularly in relation to the 0.618-0.786 Fibonacci retracement zone.
Another concerning sign for ETH has surfaced in its Net Unrealized Profit/Loss (NUPL) metric, which has now dropped into the “capitulation” range. This stage often indicates that most holders are currently in the red with their investments, and historically, similar moves have suggested that significant market bottoms are nearby. For instance, in March 2020, the NUPL dipped into negative territory right before a strong rebound following the COVID-19 plunge.
This behaviour echoed again in June 2022 when ETH hit a bear market low of roughly $880 after entering the capitulation zone. As Ethereum finds itself back in a similar state now, it seems to be at a pivotal moment that’s also aligning with crucial Fibonacci support levels close to $1,000. It’s essential for investors to remain cautious though. This analysis is purely informational and does not provide specific investment advice, which should always factor in personal research and risk assessment before any trading decisions.


Post Comment