Ethereum Faces Extended Decline as Bearish Momentum Gains
Ethereum prices continue to decline, trading below $1,800. A failed attempt to breach $1,880 has put it at risk of further losses, with key support levels indicated at $1,785 and $1,750. Technical indicators signal a bearish trend, leaving investors wary of potential extended declines.
Ethereum’s recent price movement has left many investors on edge, as it’s now showing signs of a possible extended decline following a sharp downturn. After breaking below the $1,850 mark, Ethereum (ETH) is struggling to maintain its footing and could further dip under the crucial $1,785 support level. Currently, it trades below $1,800, with the 100-hourly Simple Moving Average also hovering in a bearish alignment.
The downward pressure began as Ethereum attempted to overcome the $1,880 resistance level but ultimately failed. This setback mirrors Bitcoin’s price behaviour, as ETH fell, sliding below the $1,850 and $1,820 support points. The situation worsened as ETH dipped past the 50% Fibonacci retracement point from its recent gains. While the bears have attempted to push prices lower, a temporary support appears to hold around $1,785.
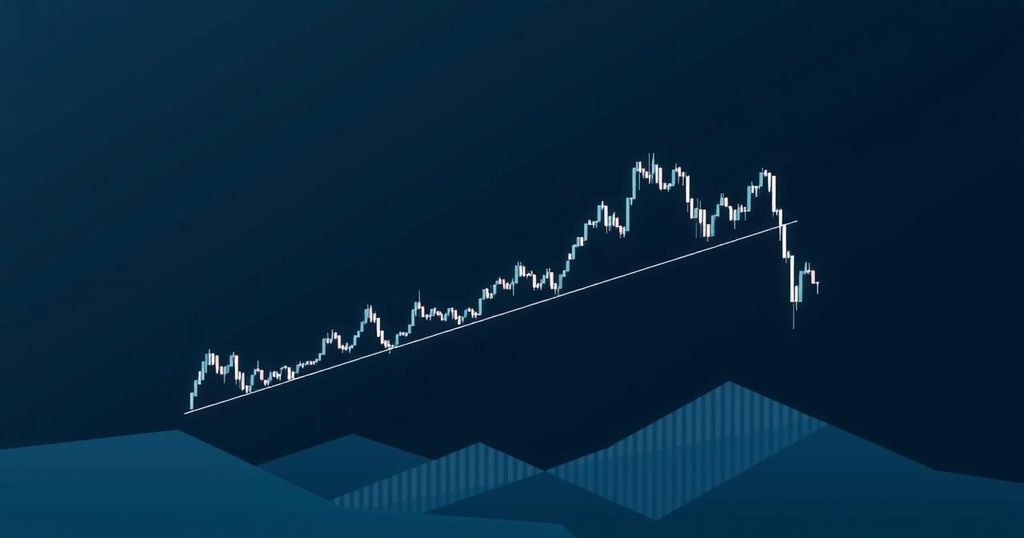
With ETH trading below the pivotal $1,800 mark, traders are eyeing a significant trend line formation—that shows resistance around the $1,830 mark on the hourly ETH/USD chart. To the upside, hurdles remain at the $1,820 level, with a more formidable barrier at $1,830 where traders might look for clearer signs of recovery. Should Ethereum break decisively over $1,880, it could aim for the next resistance near $1,920, leading some analysts to speculate a potential rise towards the $2,000 mark or possible even $2,050.
However, failure to breach the $1,830 resistance might trigger more losses for Ethereum. Those watching the charts note that initial support lies around the $1,785 level, with the significant 61.8% Fibonacci retracement also in play from its latest rise. Below that, the first notable support is around $1,750. A breach here could open the door to a drop towards $1,720, and further losses could see the price tumble down even to $1,685, with $1,640 marking the next critical support level.
Looking at the technical indicators, the hourly MACD shows a gaining momentum in the bearish zone, signalling potential for further declines. The RSI for ETH/USD is resting below the neutral 50 mark, reinforcing the bearish sentiment that seems to characterise current market conditions. The ongoing developments bring more uncertainty as investors tread carefully amidst fluctuating conditions.


Post Comment