Ethereum Sees Potential Recovery After Significant Price Drop
Ethereum has begun to recover from a 50% decline, bouncing back from around $1,600. Notable indicators point towards a potential price rise towards $2,100 in the upcoming weeks as buying interest appears to be increasing. Both RSI and MACD suggest a possible bullish trend reversal, indicating that selling pressure is decreasing while buying pressure may be on the rise.
Ethereum (ETH) is tentatively showing signs of recovery after a significant 50% drop from its 2025 peak. Following lows around $1,600, the cryptocurrency may be preparing for a rebound. Analysts, like Michaël van de Poppe, suggest that the price could break through the $2,100 barrier within the next fortnight, indicating a possible bullish shift in the market.
Recent technical analysis reflects renewed buying interest, with crucial indicators such as the Relative Strength Index (RSI) and Moving Average Convergence Divergence (MACD) suggesting an upward momentum could be on the horizon. Van de Poppe pointed out that ETH is currently holding above essential support levels, which could be paving the way for a more substantial price increase.
The price chart shared by van de Poppe depicts a stark downtrend in late 2024, with Ethereum striking a low of $1,600 in April 2025. Interestingly, although it briefly dipped below a key support level, the cryptocurrency quickly rebounded back above, hinting at waning seller pressure. This bounce back signifies an enticing entry point for potential buyers, indicating an uptick in overall market interest.
Observations on the charts suggest ETH has reclaimed this earlier support as a base for a potential upward surge. A continued climb might see it targeting around $2,100, an important milestone that, if surpassed, could signal a larger trend reversal in Ethereum’s pricing dynamics.
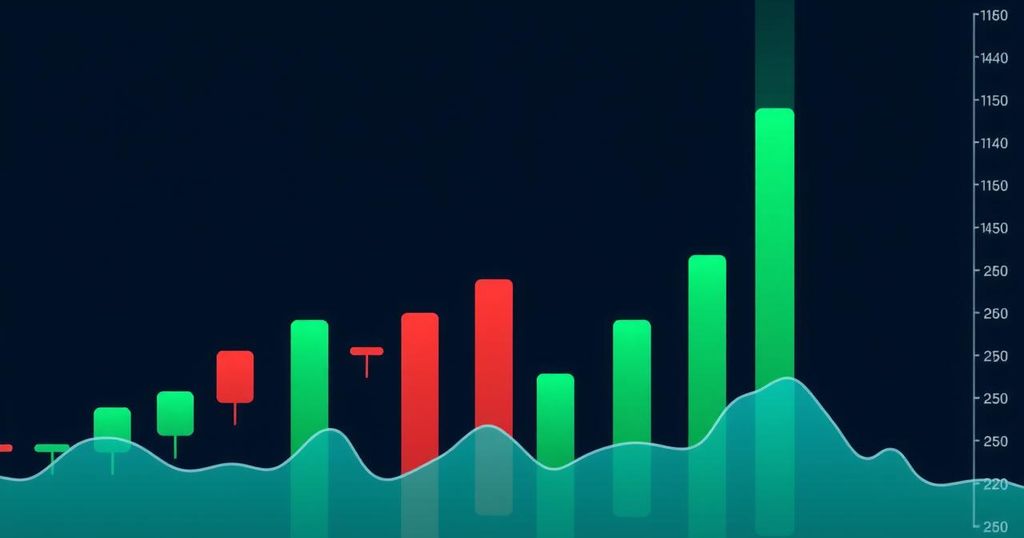
At present, Ethereum trades near $1,836 according to the ETH/USD chart from TradingView. The recent price action shows Ethereum stabilising after a lengthy downtrend, suggesting the possibility of an imminent breakout. Key indicators are starting to align in favour of upward momentum as selling pressure appears to diminish, evidenced by increasing green volume bars.
Although the RSI currently sits in bearish territory at about 36, it is slowly recovering from even more oversold conditions earlier on. Additionally, a potential crossover between the MACD lines is approaching, which is often interpreted as a bullish signal. While the MACD remains just below the zero line, there are signs that bearish momentum is weakening, suggesting the possibility of a shift toward more positive price movement in the near future.


Post Comment