Bitcoin’s Price Surge: Is Another Rally on the Horizon?
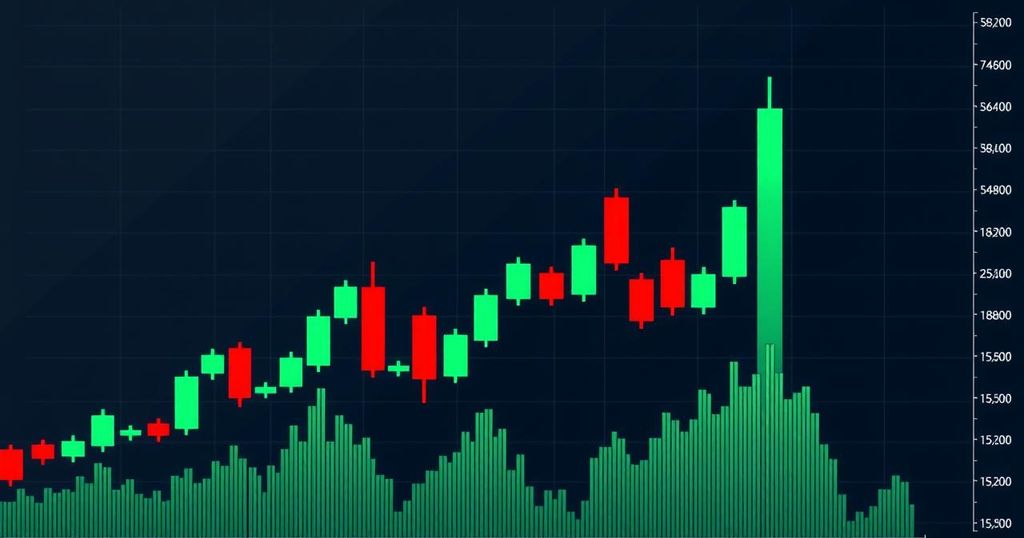
Bitcoin has surged to a new all-time high above $111,600 and is currently consolidating around $108,500. A move above $111,000 could trigger further bullish momentum, with key resistance levels at $110,750 and $111,800. However, if Bitcoin fails to break the $111,000 resistance, it may face a downward correction towards support levels at $108,000 and $107,500.
Bitcoin has kicked off a notable upward trend, recently peaking at an impressive all-time high exceeding $111,600. Currently, the cryptocurrency is in a consolidation phase, hovering around $108,500. Analysts are keenly observing, as an increase past the $111,000 barrier could signal an even stronger bullish momentum.
After bouncing back from a low of $106,800, Bitcoin’s trajectory appears promising. The price has successfully moved above both $108,500 and the critical 100-hour Simple Moving Average. Additionally, a significant break above a bearish trend line was noted, particularly one that had served as resistance around the $107,800 mark on the BTC/USD hourly chart.
As it stands, Bitcoin’s recent surge is noteworthy, having cleared previous resistance levels of $107,000 and $108,000. Notably, bullish traders pushed the price past the 23.6% Fibonacci retracement level, calculated from the highs and lows observed recently. Currently, Bitcoin is positioned above $109,000 and remains above the 100-hour Simple Moving Average, maintaining a steady bullish outlook.
Immediate resistance is observed at the $110,000 level, which also aligns closely with the 61.8% Fibonacci retracement level. Looking ahead, the first key resistance stands at $110,750, while the crucial resistance at $111,800 could lead to significant upward movement if breached. If it manages to close beyond this level, the price could escalate towards $113,000, potentially edging closer to the $115,000 mark.
However, not all analysts are optimistic. Should Bitcoin struggle to overcome the $111,000 resistance, a downside correction could be imminent. On the downside, immediate support appears at $108,000, with further support levels reported at $107,500 and $106,500. Particularly troubling would be a drop below $103,200, which may encourage bearish sentiment moving forward.
The technical indicators suggest a cautiously bullish outlook. The hourly MACD is showing signs of positive momentum, while the RSI for BTC/USD indicates a position above the critical 50 threshold. Notably, key support levels sitting at $107,500 and $106,500 need to hold to avert further selloffs in the near term.


Post Comment