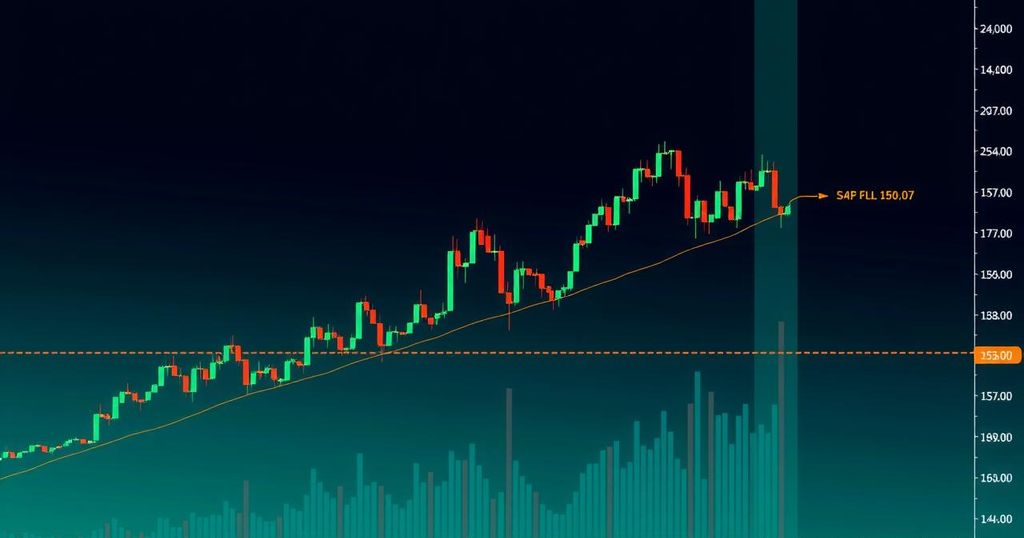
Bitcoin Price Encounters Resistance — Traders Eye Breakout or Rejection
Bitcoin is currently testing resistance at $107,000 after a decline below $105,500. A recent recovery saw Bitcoin trading above $105,000, and if it breaks through $107,800, it could potentially rise further. However, if resistance holds, another drop might occur, with crucial support levels around $105,000 and $103,200.
Bitcoin’s price action has recently made waves as it dipped below $105,500 before attempting a recovery. This decline saw the cryptocurrency testing the $103,200 support level. After hitting this low, Bitcoin began a recovery, moving above the $105,000 mark and is currently contending with resistance at around $107,000. A connecting bullish trend line is also forming, adding a layer of support at $104,050 on the BTC/USD hourly chart, according to data from Kraken.
As Bitcoin struggled below the $105,500 support, traders were on the edge as it dropped further to hit $103,200, marking the formation of a new low. A subsequent recovery wave has followed, with Bitcoin breaking above the $104,500 level and also surpassing the 23.6% Fibonacci retracement of its recent decline. This upward movement has helped Bitcoin reclaim the $105,000 threshold, and it’s trading above the 100 hourly simple moving average.
However, the path ahead is not entirely clear. Immediate resistance now lies close to $106,850, which aligns with the 50% Fibonacci retracement level of the recent high to low swing between $110,500 and $103,200. The critical level of resistance to watch is the $107,000 mark, with additional resistance at $107,800. Should Bitcoin manage to close above this latter level, it might open the floodgates towards $109,000 and even $110,000, although that’s just speculative at this stage.
In a more cautious scenario, if Bitcoin struggles to break through the $107,000 resistance zone, another decline might be on the cards. Immediate support sits around the $105,000 level, and a fall below this could push it towards the higher $104,000 mark, with the next significant support resting at $103,200. A further slip could see it fall towards $102,500 and the more concerning support level is pegged at $101,200, which if breached, could ignite bearish trends.
On the technical side, indicators aren’t incredibly bullish either. The hourly MACD appears to be losing momentum in the bullish zone, and the RSI for BTC/USD has dropped below 50, suggesting that there might be some underlying weakness. Major support levels to keep an eye on are $105,000 and $104,000, while traders are also focusing on critical resistance levels at $107,000 and $107,800.


Post Comment