Bitcoin Price Fails to Break Through $110K Resistance—What’s Next?
Bitcoin’s price is struggling to clear the $110,500 resistance level after surging above $107,500. Currently correcting gains, BTC might face further drops below $108,000. Technical indicators show waning bullish momentum, raising concerns about potential losses if resistance isn’t overcome.
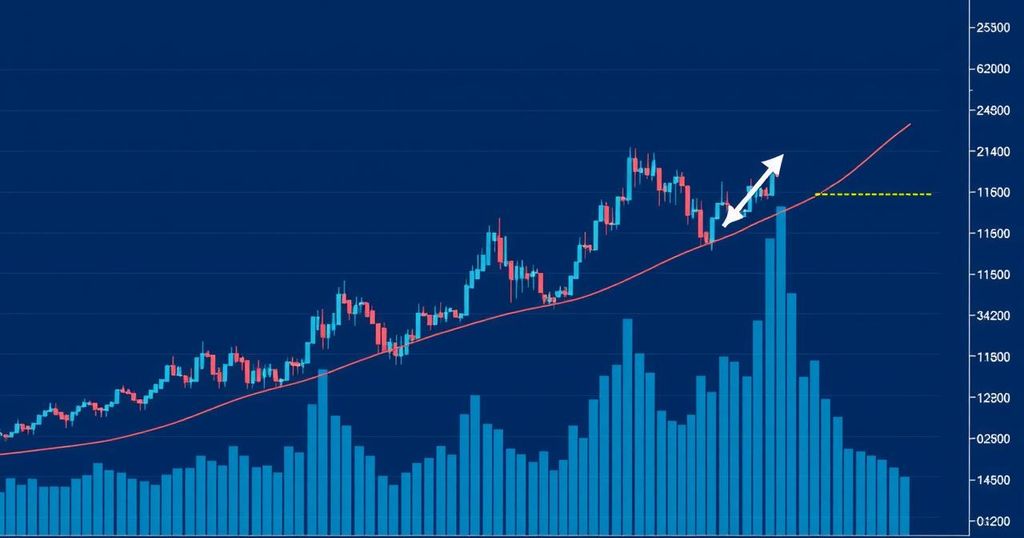
Bitcoin’s recent surge above the $107,500 mark has hit a wall at around $110,500, causing speculation on whether the rally is losing momentum. Currently, prices are hovering above $107,800 and the 100-hourly simple moving average. An hourly chart of the BTC/USD pair shows a significant break below a bullish trend line that had previously provided support at $109,450.
After Bitcoin managed to climb above the $105,500 support zone, it successfully crossed the $106,500 and $108,000 resistance levels. Enthusiastic bulls pushed the price to approximately $110,375, but a correction has since set in. The latest movements show a retreat below the 23.6% Fibonacci retracement level from a swing low of $105,477 to the recent high of $110,373.
Immediate resistance lies at the $109,250 mark, with the crucial thresholds at $110,000 and potentially at $110,500 – a price point that could see further upward movement towards $112,000 if crossed. Analysts suggest that should Bitcoin close above $110,500, it may well pursue a target near $115,000, igniting bullish sentiment once more.
Conversely, if Bitcoin doesn’t manage to break through the $110,000 barrier, a downward trend could emerge. Key support levels are currently noted at the $108,000 level and the 50% Fibonacci retracement of the recent upward progress from $105,477 to $110,373. Major supports follow at $107,350, and further declines could bring prices to the $106,550 zone, ultimately dropping towards $105,500 if sellers regain control.
Technical indicators provide further insight into the market sentiment. The hourly MACD is losing traction in the bullish zone, while the Relative Strength Index (RSI) has dipped below 50, suggesting a potential bearish shift. As it stands, traders are eyeing the next critical levels of resistance and support to gauge Bitcoin’s short-term trajectory.
In summary, Bitcoin’s price dynamics are currently at a crossroads, testing resistance levels that could dictate its next moves. For investors, it’s a wait-and-watch game as the cryptocurrency faces a pivotal moment in its trading journey.


Post Comment