Bitcoin Following ABCD Pattern? Analyst Sees Path to $137,000
Bitcoin faces pressure from geopolitical tensions, dropping 1.7% recently. Analysts note that BTC is potentially following an ABCD pattern, which could lead to a price target of $137,000. While some indicators suggest a new all-time high, recent data shows long-term holders selling, raising concerns about future price momentum.
Amid rising tensions between Israel and Iran, there’s a notable shift in investors’ sentiments, affecting high-risk assets like Bitcoin (BTC). Over the last day, Bitcoin experienced a dip of 1.7%, leaving many to wonder about its future trajectory. However, some technical indicators suggest a possible march towards a new all-time high (ATH) later this year.
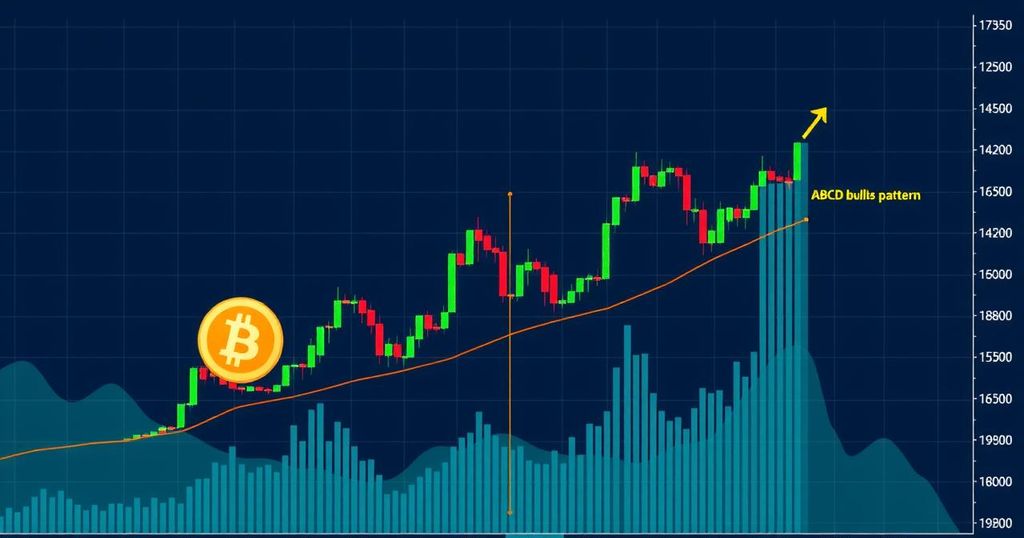
The crypto analyst known as Titan of Crypto has recently pointed out an intriguing development in the market. Bitcoin seems to be following the ABCD pattern, currently showcased in a wedge formation. If Bitcoin breaks free from this pattern, it might just reach heights of $137,000. For those unfamiliar, the ABCD pattern is a popular chart formation that features four key points: AB, BC, and CD, where AB and CD should ideally be of equivalent lengths, indicating potential price reversals.
In addition to the ABCD analysis, various other signs are indicating the possibility of Bitcoin reaching a new ATH soon. Another analyst, Crypto Caesar, made waves with a 4-hour chart that illustrates a bullish double bottom formation, hinting that Bitcoin is gearing up for a rebound. Moreover, Jelle, another commentator in the crypto space, has highlighted a cup and handle pattern taking shape on the daily BTC chart, suggesting that Bitcoin is forming a “cup” and is now developing the “handle,” typically a precursor to an upward price swing.
Adding to these optimistic signals, crypto trader Merlijn the Trader noted intriguing developments with the Hash Ribbons indicator. This on-chain metric has historically been linked to significant rallies in Bitcoin’s price, and Merlijn suggests that the latest intersection of moving averages indicates strong bullish momentum. The Hash Ribbons use Bitcoin’s 30-day and 60-day hash rate averages to gauge miner activity and market health, signalling bullish trends when the 30-day crosses above the 60-day.
However, it’s not all sunshine and rainbows for Bitcoin at the moment. While BTC holds above the critical $100,000 mark, there are troubling signs surfacing. Recently, the cryptocurrency faced rejection at the $110,000 resistance level, which has temporarily empowered bearish sentiment in the market. Additionally, on-chain metrics indicate that long-term holders of Bitcoin are starting to offload their investments, a trend usually witnessed in the later stages of a bull market cycle.
Short-term holders also seem to be losing faith, as shown by their recent market actions. As of now, Bitcoin is trading at $105,568, marking a 1.7% drop in the last 24 hours. This fluctuation raises questions about whether BTC bears are starting to gain more ground or if it’s just a temporary blip on the road to potential new highs.


Post Comment