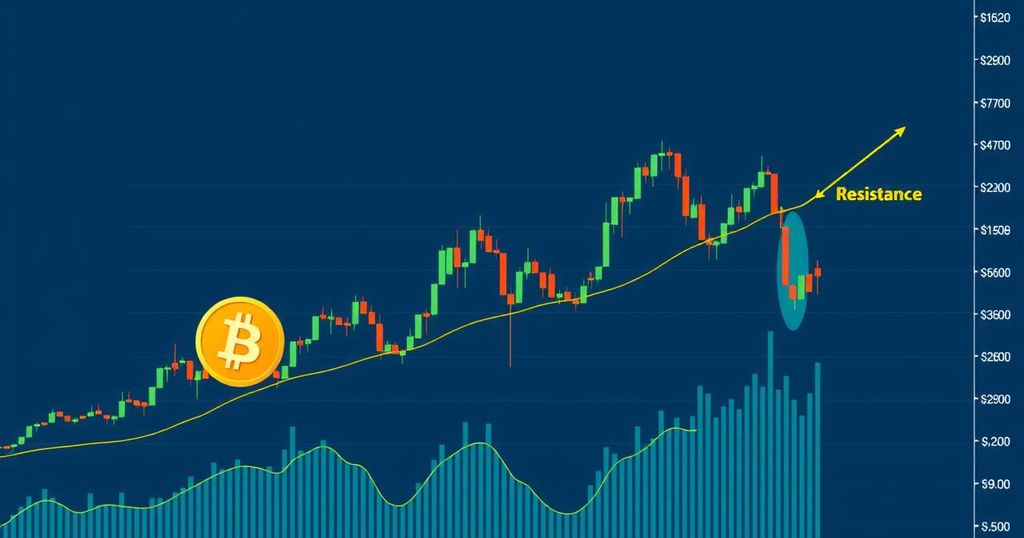
Bitcoin Price Stumbles at Resistance — Will the Dip Deepen?
Bitcoin’s price has dropped below $106,800 as it struggles against resistance levels. After failing to break past $108,800, it fell to $103,400 and is now trying to stabilize. Immediate support exists at $104,200 while key resistance levels to watch are $105,500 and $106,200. A slip below $102,500 could lead to deeper losses.
Bitcoin’s recent price trajectory shows a notable decline after failing to break through the key resistance level at $108,800. Following this, the cryptocurrency saw a drop below both the $108,000 and $107,000 thresholds. Notably, there was a decisive move beneath the crucial $106,200 support, plunging the price down to around $103,400, where it now seeks stability amidst this downward trend.
Currently, Bitcoin is trading below the $106,800 mark and has also fallen under the 100 hourly Simple Moving Average, indicating a bearish sentiment among investors. Analysis highlights the formation of a short-term triangle, with support pegged at the $104,200 level on the hourly chart for the BTC/USD pair, sourced from Kraken. If Bitcoin can maintain levels above $103,500, there’s potential for a rebound; however, an immediate resistance looms nearby at $105,200.
Looking ahead, the first significant resistance stands at $105,500, followed by a pivotal $106,200. This latter figure coincides with the 50% Fibonacci retracement from the earlier downswing, which could be a crucial turning point for buyers. If Bitcoin mounts a successful challenge to the $106,200 resistance, it could open the door for price movements towards the $108,000 and even the $110,000 levels.
However, should the market fail to push past the $106,200 resistance, we might see Bitcoin enter a new downward spiral. The immediate support, crucial for bulls, is bracketed around $104,200, with the major support placed at $103,500. In a worse-case scenario, if the price goes beyond $102,500, we could face tough resistance around $101,200 and the significant psychological barrier of $100,000.
Technical indicators paint a somewhat dire picture: the MACD is losing momentum while firmly positioned in the bearish zone, and the RSI for BTC/USD is currently below the neutral mark of 50. The levels to watch are clear – major support levels rest at $104,200 and $103,500, with resistance starting at $105,500 and crucially at $106,200. The market is indeed at a pivotal juncture, with traders keenly observing these critical levels to gauge Bitcoin’s next move.


Post Comment