Ethereum Price Analysis: Is ETH Headed Towards $2,800 or $2,000?
Ethereum’s price movements are raising eyebrows as traders-question whether it can claw its way up to $2,800 or if it’s headed for a crash to the $2,000 level. The stakes are high as market dynamics shift.
Ethereum Faces Deciding Moment at Key Levels
Ethereum’s market movements have kept traders on edge lately. The cryptocurrency has been grappling with a significant shift in its price dynamics, especially after it dropped below the ascending flag pattern that had been sustaining its upward trend. As ETH retraces to test the broken trendline, the looming question is whether it can push towards the $2,800 mark or will it face a tumble back to around $2,000? It’s rather critical to observe how the selling pressure manifests in order to predict the next moves in this volatile market.
Key Resistance and Support Levels
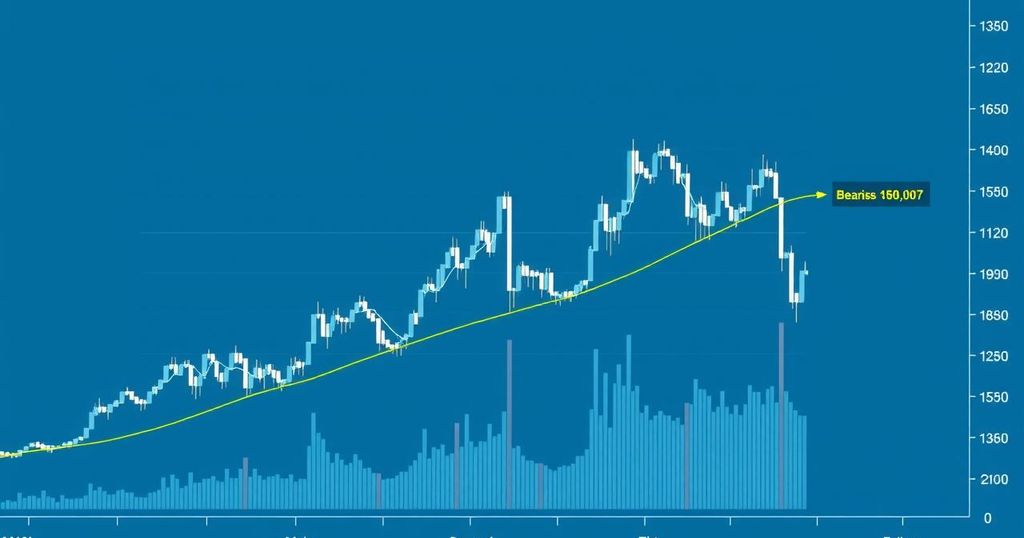
Looking at the daily chart, the recent breakdown from the ascending flag has triggered a corrective phase that caught many off-guard. Strong support emerged around the $2,100 mark, allowing for a minor rebound that saw Ethereum edging up to the $2,400 trendline. Yet, it appears now this level is posing significant resistance. Notably lacking the sort of volatility that typically signals bullish momentum, the current situation suggests that buyer enthusiasm may be tapering off leading to further selling pressure, which could push ETH back towards that crucial $2K support level that bulls must protect.
4-Hour Chart Insights and Fibonacci Levels
Diving into the 4-hour chart, a closer inspection reveals ETH initially found a decent footing within the 0.5–0.618 Fibonacci retracement zone where some traders find solace. However, after a brief rally, it hit a wall at the lower boundary of the previous flag formation around $2,400. This area now firmly acts as resistance, raising concerns about a potential downturn unless buyers manage to regain momentum quickly. The $2,100 region is still crucial as it overlaps with fib support — should it hold, the bullish narrative might just hang on a little longer, otherwise deeper declines could loom in the near future.
Onchain Analysis Signals Market Sentiment Shift
Meanwhile, on-chain analysis unveils interesting observations. The funding rate, which reflects trader sentiment in the futures market, shows a declining trend. Usually, this signals a potential slowdown in bullish sentiment, hinting that traders may be running out of steam. This current trend points towards a possible rejection and a deeper correction ahead. Encouragingly, as funding rates approach neutrality—hovering near the zero mark—it could mean that leveraged positions are being reset. Often in these moments, new demand surfaces, which could lead to renewed bullish trends following the consolidation phase currently in play.
Market Dynamics: Bullish or Bearish Future?
As we move forward, ETH’s journey hinges on the balance of power between buyers and sellers. The critical price levels around $2,100 and $2,400 will dictate the next steps for Ethereum in this suspenseful drama. If bulls can reclaim those levels, we may indeed see a rally back towards $2,800. Otherwise, the impending risk of a drop to $2,000 looms large and presents a challenging scenario for investors and traders alike. Observing the trading volumes and market dynamics will be key in the days ahead to gauge where ETH is headed next.
In summary, Ethereum’s current market analysis presents a fascinating yet precarious situation. The broken ascending flag pattern suggests a correction may be underway with the ETH price struggling around the $2,400 level. Maintaining support near $2,100 could be crucial to avoid a slump back to the psychological $2K mark. It’s a delicate balance, and the next few days could be telling for whether ETH will continue to the anticipated $2,800 or falter downwards.


Post Comment