Ethereum Price Stays Near $2,440 As Traders Anticipate Breakout
Ethereum’s price stabilizes close to $2,440 as traders hold their breath for a breakout from its tight, ongoing consolidation. Will the cryptocurrency finally make its move?
Ethereum’s Current Price Action: Key Levels to Watch
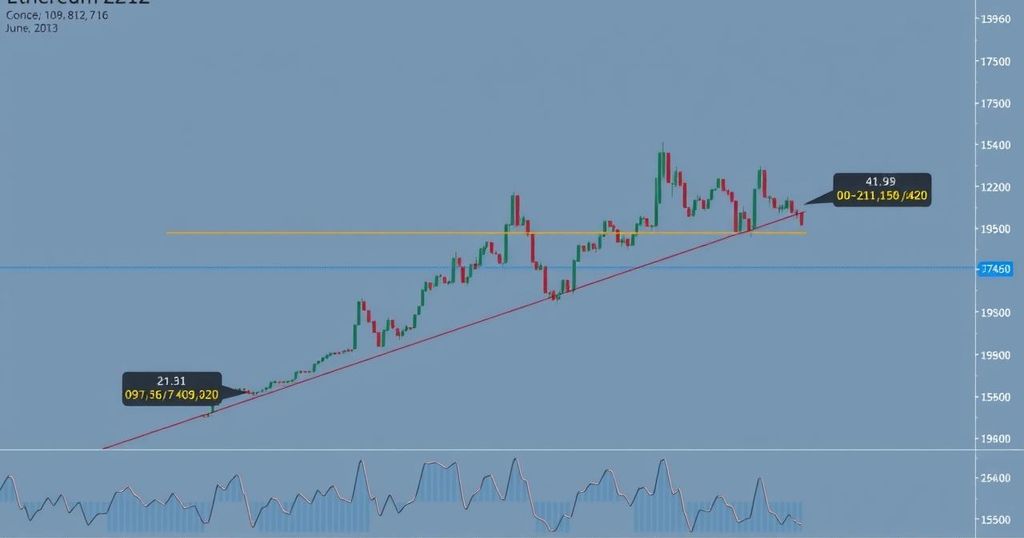
Ethereum is hovering around the $2,438 mark as of Friday, continuing its tight consolidation in a symmetrical triangle pattern. This movement comes after a modest bounce from last week’s low of approximately $2,300, which found support along a trendline that has been in place since the lows of May. Traders are intently watching the situation, anticipating a breakout from this squeezed range that could determine the next move in price action.
Resistance Levels and Market Sentiment
Despite the recent resilience, Ethereum has faced challenges, particularly at the $2,480–$2,500 resistance zone that has continually halted any bullish advances. This ceiling has proven to be a tough nut for bulls to crack since early June, leading many to question whether upward momentum can build. For ETH to regain control and shift the sentiment to a bullish outlook, a break above $2,580 is essential; otherwise, the downside risk could push prices toward $2,260.
Technical Indicators Point Toward Indecision
Looking into the daily charts, the picture becomes clearer; Ethereum grapples with an ongoing indecision within the symmetrical triangle formation. While the price has held firm above the lower boundary, the overhang of selling pressure evident between $2,580 and $2,860 represents a significant hurdle. A definitive breakout above this cluster could be what traders need to reignite bullish momentum, potentially pushing the price towards the psychological level of $3,000.
Volatility Indicators Suggest Breakout May Be Near
Zooming in on the 4-hour chart, a minor triangle is visible as well, revealing Ethereum’s struggle just below that critical resistance area. The Bollinger Bands are tightening around the current price, which sits between the middle band and a flat EMA cluster (averaging $2,426 to $2,468). This signals a low-volatility environment that typically precedes a breakout, though the immediate momentum appears weak at best. Currently, the RSI floats around 50 and a hint of hidden bullish divergence exists, indicating some support underneath the surface.
Awaiting a Catalyst for Directional Movement
In summary, Ethereum’s trajectory remains ambiguous—but thrilling. For several weeks now, the cryptocurrency has moved within this triangle pattern, with attempts to break through resistance met with firm rejections. Until ETH decisively breaks above the $2,580 mark or slips under the structural support near $2,260, the outlook stays neutral. The trading community remains in suspense, waiting for any catalyst that could spur a significant price movement in the next session.
In essence, Ethereum is at a critical juncture, with its price lingering near $2,440 amid tight consolidation. The market sentiment hovers around uncertainty, with resistance looming above and support below. With contradicting signals from several technical indicators, traders continue to wait for a breakout that may ultimately dictate Ethereum’s direction for the near future.


Post Comment