Ethereum Price Faces Ongoing Decline Amid Market Share Losses and Bearish Signals
Ethereum’s price has plummeted to 0.01890, its lowest since January 2020. This 80% decline from its 2021 high is part of a broader trend where Ethereum is losing market share to competitors like Solana and emerging layer-2 networks. A technical analysis indicates further potential decline, with an inverse cup and handle pattern suggesting the possibility of revisiting its all-time low.
Ethereum (ETH) is facing a serious downturn against Bitcoin, with a significant drop to 0.01890, marking its lowest point since January 2020 and reflecting an 80% decline from its 2021 peak. This price decline isn’t just a one-off; it coincides with Ethereum’s diminishing market presence across crucial sectors of the cryptocurrency landscape, particularly highlighted by new data from DeFi Llama. For instance, during April, Ethereum protocols processed only $56 billion, lagging behind Solana’s (SOL) impressive $72 billion during the same period, indicating a clear trend of market share erosion.
The situation grows even starker when considering Ethereum’s competition from layer-2 networks aiming for increased scalability and transaction speed without losing security. Coinbase’s Base, for example, processed transactions worth $20 billion in April. Furthermore, Unichain, a newly launched layer-2 network, handled $3.4 billion, while Arbitrum added another $14.3 billion. Collectively, these transactions could have significantly supported Ethereum’s processing capabilities had they occurred on its mainnet.
In the wider cryptocurrency market, Bitcoin’s dominance has been climbing steadily, now at 63%, a notable increase from its year-to-date low of 18%. This marks Bitcoin’s highest market share since November 2021. In stark contrast, Ethereum’s dominance has plummeted to just 7%, the lowest it has been since April 2018, effectively compounding its ongoing struggles.
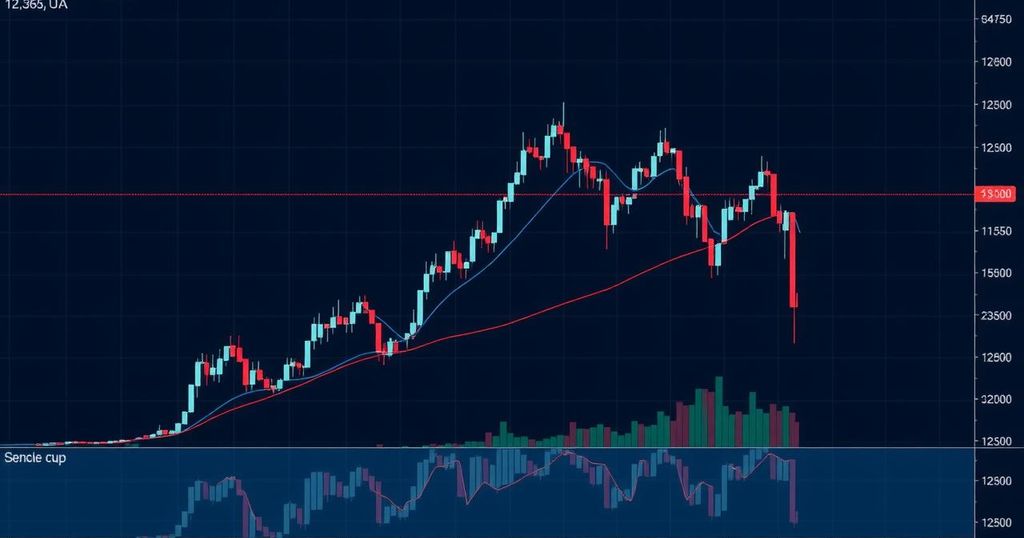
From a technical standpoint, analysis of the ETH/BTC chart portrays a grim picture. Since peaking at 0.08810 in December 2021, the pair has seen a staggering 80% drop to its present level. Currently, Ethereum trades below both its 50-week and 100-week moving averages, a bearish indicator. The Money Flow Index—often used to gauge momentum—has fallen to an oversold position of 14, further signalling weakness.
Adding to the bearish sentiment is the Average Directional Index which has surged to 48.75, highlighting that the downward momentum remains robust. Alarmingly, an inverse cup and handle pattern is emerging on the chart, which typically signals more downside. This pattern is distinguishable by a horizontal support line paired with a rounded top, and if it continues to unfold as anticipated, one potential target could be the 0.0070 level, which previously marked December 2016’s bottom. A drop past this point might trigger fears of revisiting the all-time low at 0.0019, a scenario that many investors would rather avoid.


Post Comment