Bitcoin Trading Update: Bearish Trends Emerge Amidst Bullish Support
Bitcoin trades at $96,101 with a market cap of $1.907 trillion. Recent patterns show both bullish trends and bearish pressures, with critical support around $90,000. Volume decline during the upward trend indicates potential reversal signals. A pullback may be likely, while short-term indicators lean bearish, suggesting careful monitoring of key price levels ahead.
Bitcoin is currently trading at $96,101, with a significant market capitalization of $1.907 trillion. In the last 24 hours, the cryptocurrency witnessed a trading volume of approximately $21.413 billion, fluctuating between $95,944 and $97,821 throughout the day.
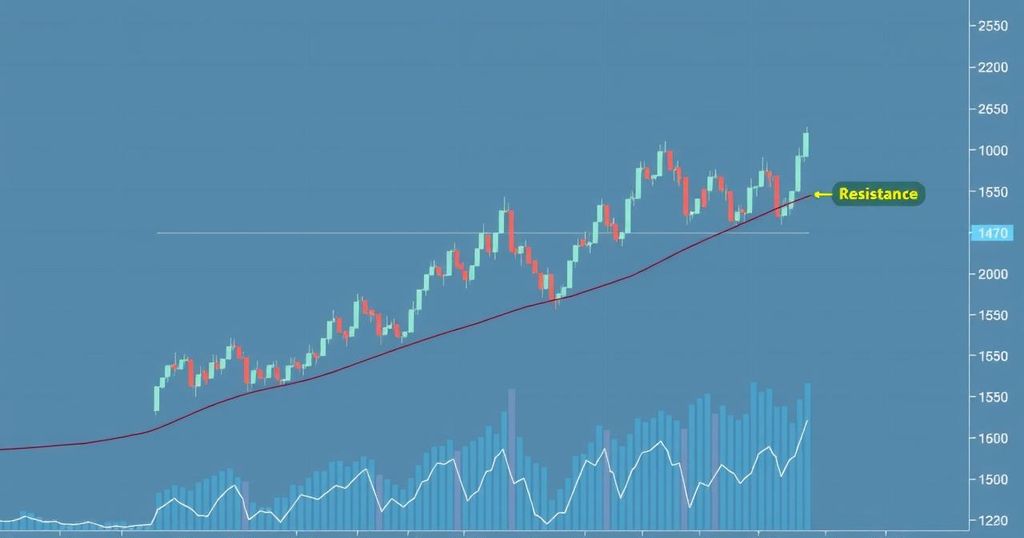
On the daily chart, Bitcoin (BTC) has shown a bullish trend, rising from $74,434 to a high of $97,938 recently. However, the trading volume that accompanied this rise is now starting to decline. This decline is concerning as it may foreshadow a loss of bullish momentum. Additionally, a rising wedge pattern has appeared, often associated with potential price reversals. Immediate support can be identified between $90,000 and $91,000, while secondary support hovers around $84,000. Traders are urged to keep an eye out for a potential dip to the $90,000-$92,000 range for buying opportunities, with caution if the volume decreases below $90,000.
From the 4-hour chart perspective, a sideways-to-bearish trend is unfolding since Bitcoin hit its peak on May 1. Lower highs have emerged, hinting at a further downtrend, particularly following a notable red volume bar on May 2, suggesting increasing selling pressure. At the moment, prices are oscillating between $96,000 and $97,000, indicating uncertainty in the market. If the price can break above $97,500 with robust volume, we could see a short-term upswing; conversely, a drop below $96,000 might trigger a pullback towards the $94,000 support level.
Looking at short-term signals from the 1-hour chart, outlooks appear to be bearish. The double top pattern that formed near $97,938 has resolved downwards, as evidenced by lower highs and lower lows currently in play. Additionally, increasing volume on red candles shows sellers are in charge of intraday trading. Key immediate support lies between $95,500 and $95,800; a break here could lead down to $94,500. On the opposite end, if the price manages to reclaim $96,500 with significant bullish volume, it could open opportunities for intraday trading.
Oscillator readings across various timeframes signal neutrality. Indicators like the relative strength index (RSI) and the moving average convergence divergence (MACD) present conflicting viewpoints, with the momentum indicator flashing a sell signal while the MACD sits in buy territory. This reflects a tug-of-war between short-term selling pressure and a longer-term bullish outlook.
For longer analyses, moving averages remain strong, signalling positive trends. The values for both exponential moving averages (EMA) and simple moving averages (SMA) across multiple periods—from 10 to 200—remain bullish. Despite the immediate bearish pressures seen on shorter timeframes, these sustained buy signals from long-term moving averages hint at overall market strength.
In terms of bullish sentiment, despite some short-term signs of fatigue and consolidation, Bitcoin maintains a constructive structure across higher timeframes. Constant buy signals from key moving averages, backed by solid support levels and MACD indications, imply a soothing pullback might set the stage for another uptrend, especially if buying pressure can retake $97,500 with volume.
Conversely, the bearish viewpoint is backed by growing selling pressure, particularly evident in the lower timeframes. A combination of factors, including the rising wedge formation and the double-top breakdown, alongside increased selling volume, heightens the likelihood of a deeper price correction towards $90,000-$94,000 support zones in case selling momentum picks up.


Post Comment