Bitcoin Price Pullback: Traders Adjust Leverage Amid Sell Signals
Bitcoin has pulled back to around $103.6K after a significant rally, with the TD Sequential indicator issuing a sell signal on the 12-hour chart. Traders are reducing leverage, a cautious move amid recent volatility, while resistance levels are noted above $105K. Although short-term signals suggest possible price corrections, long-term projections remain optimistic with large holders continuing to accumulate Bitcoin.
Bitcoin prices have pulled back slightly, currently hovering around $103.6K following a significant rally. The TD Sequential indicator issued a sell signal on the 12-hour chart, suggesting traders may be looking to consolidate their positions after an impressive gain of nearly 10% in just five days. Important liquidation levels sit above $105K, hinting at resistance that could affect any further upward movement for the cryptocurrency.
Over the past week, Bitcoin has shown remarkable momentum, climbing from approximately $96,000 to $103,662. Bulls appeared strong, pushing higher closes. But, in an interesting twist, the 12-hour chart is now flashing a warning sign. Ali Martinez pointed out that the TD Sequential indicator has created a sell signal, often following major price surges, indicating a potential market slowdown may be on the horizon.
Historically, similar signals on the chart have been followed by price corrections. Currently, with Bitcoin above $103,000, the sell signal may prompt traders to take profits, potentially pushing the price back down to around $100,000 or $98,000, even though the broader upward trend remains firmly intact.
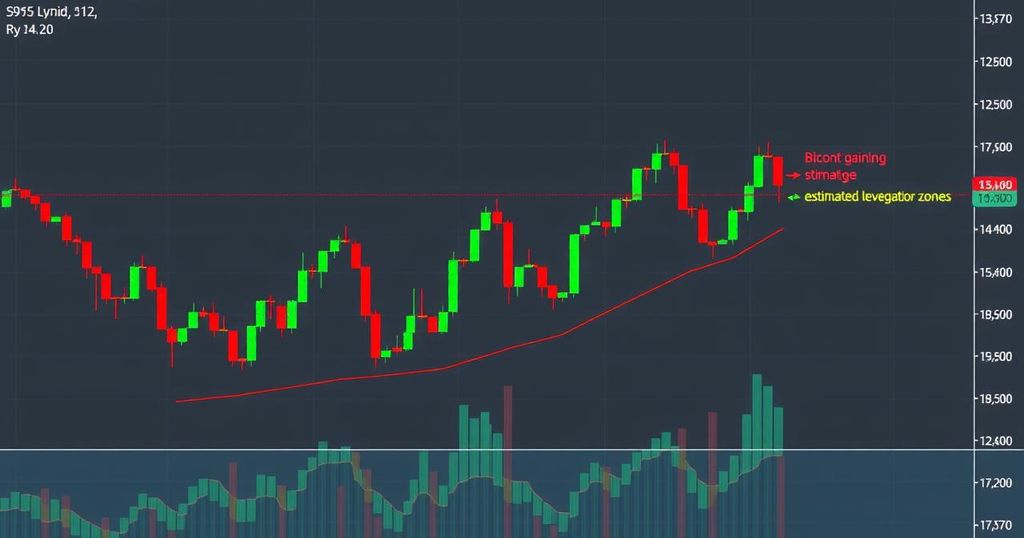
In terms of leverage, a notable shift has occurred. According to CryptoQuant, overall leverage on exchanges has dipped, with the Estimated Leverage Ratio falling from 0.258 to 0.235 between May 5 and May 9. During this same period, Bitcoin’s value rose beyond $103,000. This decline in leverage indicates traders are reducing their exposure levels, a typical move amid heightened volatility.
Deleveraging, particularly during price rallies, frequently suggests that gains are being driven by direct purchases rather than heavy leverage. This reduction helps diminish the chances of drastic price shifts or liquidations, indicating a potential market stabilisation.
Furthermore, Alphractal’s data supports recent observations about liquidation levels, showing clustering above the $105,000-$110,000 range. These specific price zones are ripe for significant liquidation events if Bitcoin’s price manages to reach them. Hot zones presented in deep red and orange on the heatmaps point to where substantial capital might be unwound should the market surge. Conversely, a shrinking green area below $100,000 indicates that price drops are less likely to spark widespread liquidation.
Still, the anticipated direction of Bitcoin is mixed. The most recent analysis using Alphractal’s Bitcoin Fractal Cycle chart posits that the market may be in the markup phase of an extended cycle. Historically, such cycles repeat every four years, showcasing bear markets, accumulation periods, and distribution phases. According to this model, we can expect a significant peak around October 12-16, 2025, after which a downturn in 2026 could follow. This pattern suggests Bitcoin typically hits a high one year post-halving, and the current trends appear to align with this timeline.
So while short-term sell signals and liquidation risks could indeed sway Bitcoin’s immediate moves, the long-term outlook appears more hopeful. Large holders remain active in accumulating Bitcoin, hinting at potential upside ahead.
But a word of caution: this article merely reflects the author’s views and should not be deemed as investment or trading advice. As always, anyone investing in cryptocurrencies should tread carefully due to the inherent risks of financial loss.


Post Comment