Bitcoin and XRP Price Analysis: Navigating Current Market Dynamics
Bitcoin’s price is currently trapped in a tight range between $83,524 and $84,156, reflecting market indecision, with key resistance identified at $84,500. A breakout could signal bullish momentum towards $87,000, while failure might indicate renewed bearish pressure. Similarly, XRP shows consolidation near $2.14, with resistance at $2.25 complicating bullish perspectives and a potential breakout anticipated, although vigilance against selling pressure is warranted.
Bitcoin has recently shown limited price activity, oscillating between $83,524 and $84,156, indicating a momentary consolidation. Its market cap stands at $1.66 trillion, with a 24-hour trading volume of $25.66 billion, while intraday trading had a range from $83,219 to $86,186. The one-hour chart suggests market indecision despite a brief recovery attempt from a low of $83,102, though a bearish trend prevails with lower low formations. A bullish breakout above $84,000 with strong volume could signal upward potential towards $85,500, while a decline past $83,000 may push prices to $81,500, indicating renewed bearish strength.
The four-hour timeframe presents a bearish trend with lower highs following a rejection at $86,450. A recent volume surge at this rejection demonstrates diminishing momentum. Nevertheless, short-term support exists between $83,000 and $83,500, in a tightening consolidation phase, often leading to volatility. A decisive break above $84,500 could suggest a retest of resistance around $86,500, but traders should remain alert for potential false breakouts.
On the daily chart, bitcoin appears to rebound from a swing low at $74,434, supported by capitulation volume forming a solid base. Currently consolidating near $84,000, bitcoin’s decision to break the $87,000 resistance or pull back to $78,000 remains uncertain. A higher low formation could indicate a longer-term bullish reversal if supported with volume.
Momentum indicators show a neutral market stance, with various oscillators indicating indecision. However, the MACD hints at a slight bullish bias, suggesting that while momentum builds, the market is yet to confirm a clear direction. Short-term moving averages provide bullish signals, while longer-term indicators favour a bearish outlook, highlighting a battleground scenario demanding volume-confirmed breakouts to clarify market direction.
For bullish expectations, a break above the $84,500 level with rising volume could usher in bullish momentum towards $87,000 and beyond, supported by short-term buy signals. In contrast, failure to reclaim $84,500 and a drop below $83,000 could amplify selling pressure, plausible returns to $81,500 or $78,000 given current longer-term bearish signals.
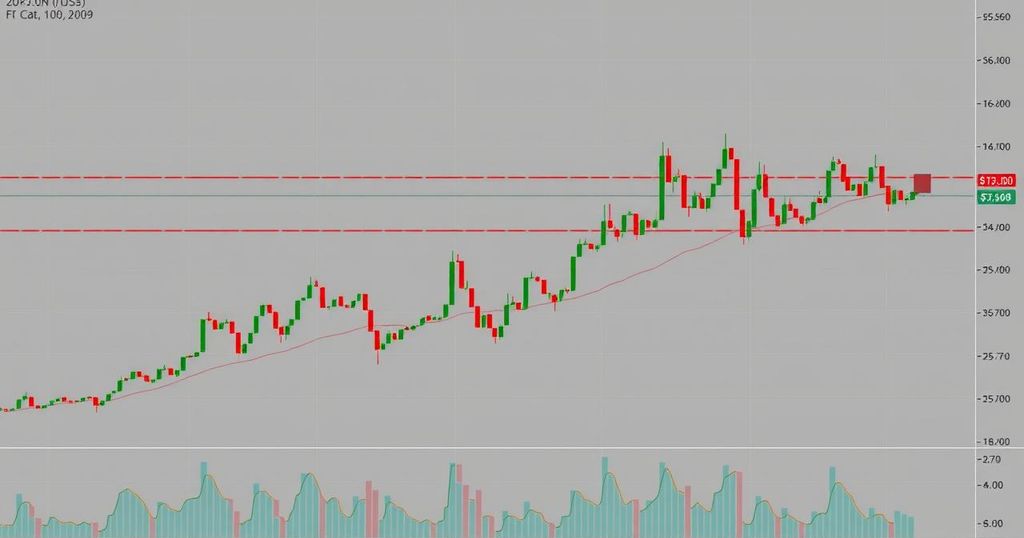
Similarly, XRP is trading at $2.14, with a market cap of $124 billion and a trading volume of $2.47 billion. The price fluctuates between $2.103 and $2.185, showcasing short-term consolidation. The one-hour chart indicates a tight trading range with multiple resistance encounters above $2.18, as volume decreases, pointing towards a potential breakout opportunity for traders.
The four-hour chart illustrates a recent bullish breakout reaching $2.25 before experiencing sideways consolidation. This creates a bullish flag indicator, signalling possible continuation upon a volume-supported breakout. With established support at $1.92, a decisive move above $2.25 could promote gains towards $2.40.
On the daily chart, XRP shows resilience after bouncing from a low of $1.611, currently stabilising between $2.10 and $2.20. Recent bullish candles indicate a possible reversal, cemented by increased trading volume during the rebound. Key resistance is at $2.59, while support is expected between $1.90 and $2.00 for entry opportunities.
Oscillators indicate a lack of strong momentum, reflecting a neutral market. Nonetheless, while some bearish indicators emerge, the MACD remains bullish, indicating a slight upward sentiment. Short-term moving averages reflect a bullish outlook, contrasting with longer-term averages that signal bearish sentiments, necessitating careful consideration for potential directional bias.
Bullish expectations for XRP suggest that with a break past $2.25, the ongoing bullish flag formations could propel prices towards $2.40, leveraging existing momentum. Conversely, resistance at $2.18 and $2.25 may foster renewed selling pressure if breached downside, with a possible downturn towards $2.00 if volume persists to decline, heightening caution for traders involved in XRP positions.


Post Comment