Bitcoin Price Analysis: Is BTC’s Rally Sustainable or Due for a Pullback?
Bitcoin hovers near $108,000 following a recent rally from lower April prices. The daily and 4-hour charts suggest potential for both upward movement and a possible pullback. On-chain data indicates bullish sentiment, noting a decline in exchange reserves, which might support price increases if macroeconomic conditions allow.
Bitcoin’s price has been teetering around the $108,000 region, showing some resilience after a steep ascent from the lows recorded in April. Currently, it seems like it’s consolidating in a tight range, but the momentum has dipped a notch. This puts us in a critical phase awaiting what the next few days might unfold for BTC.
Looking at the daily chart, Bitcoin is maintaining its position above the important 100-day and 200-day moving averages, which hover between $90,000 and $96,000. Interestingly, these moving averages have crossed in a bullish fashion recently. The Relative Strength Index (RSI) is at 63, indicating that while the rally hasn’t reached a fever pitch, it’s definitely nearing the higher limits. A stable consolidation around the $108,000 mark could act as the launchpad for a further upward movement if the bullish energy persists along with adequate trading volume.
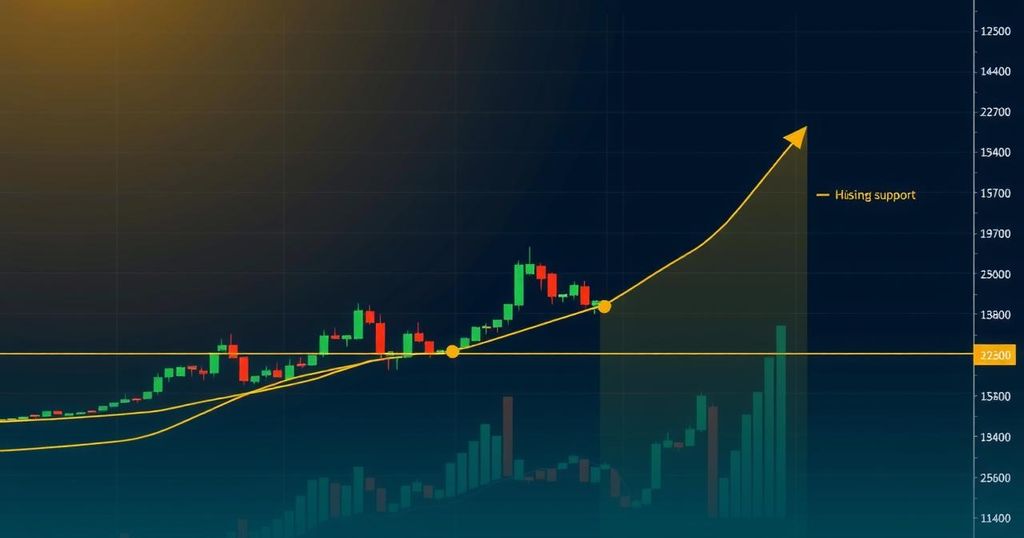
Switching to the 4-hour chart, we can see a somewhat promising rising channel in the price action. However, the recent slip below the lower trendline raises some eyebrows. On a positive note, Bitcoin has found solid footing at the $106,000 horizontal support level, which has now become the intraday support zone. The RSI is sitting around the neutral 50 level, which suggests the momentum is balanced after a short correction period. A clear breakthrough and closure above $109,000 could pave the way for a push toward the $112,000–$115,000 bracket. In contrast, if the price slips below $106,000, we might need to brace for a potential pullback heading towards the $102,000–$100,000 region.
Then there’s the sentiment analysis. The on-chain data paints a strong bullish picture—exchange reserves are dropping to multi-year lows, currently at about 2.4 million BTC. This declining trend hints that investors are shifting BTC off exchanges, likely to hunker down for the long haul, which, in turn, tightens sell-side liquidity. With supply decreasing and prices inching upwards, the environment seems favourable for increased valuations, provided that macroeconomic conditions remain positive and institutional demand continues to flourish.
And just a little something extra for our readers—CryptoPotato has some exclusive Bitcoin deals. You can nab up to $600 on Binance through their registration link or check out Bybit for a $500 free position if you register using the specified link.
That being said, the insights shared here are solely from the writers quoted and don’t reflect the viewpoints of CryptoPotato. Always do your own research before diving into investments; do so at your own risk. Check the disclaimer for further information.


Post Comment