Bitcoin Price Forms Descending Triangle Pattern Amid Israel-Iran Tensions
Israel-Iran tensions are influencing the Bitcoin market, forming a descending triangle pattern. After failing to reclaim $110,000, Bitcoin is currently caught between moving averages with a potential bearish breakout likely. Ongoing geopolitical tensions may catalyse significant price movements, either pushing Bitcoin below $102,000 or giving it space to retest higher levels.
The latest rise in tensions between Israel and Iran has stirred unease in global markets, prompting investors to tread carefully. Amid this backdrop, Bitcoin’s technical indicators are offering conflicting messages, hinting at potential breakout scenarios in either direction. Following a failed attempt to pierce the $110,000 level earlier this week, Bitcoin’s price now sits just below the 21-day moving average, yet remains above the support provided by the 50-day moving average. This mix of averages, alongside a clearly marked trendline resistance, has formed a descending triangle pattern indicative of tightening price action.
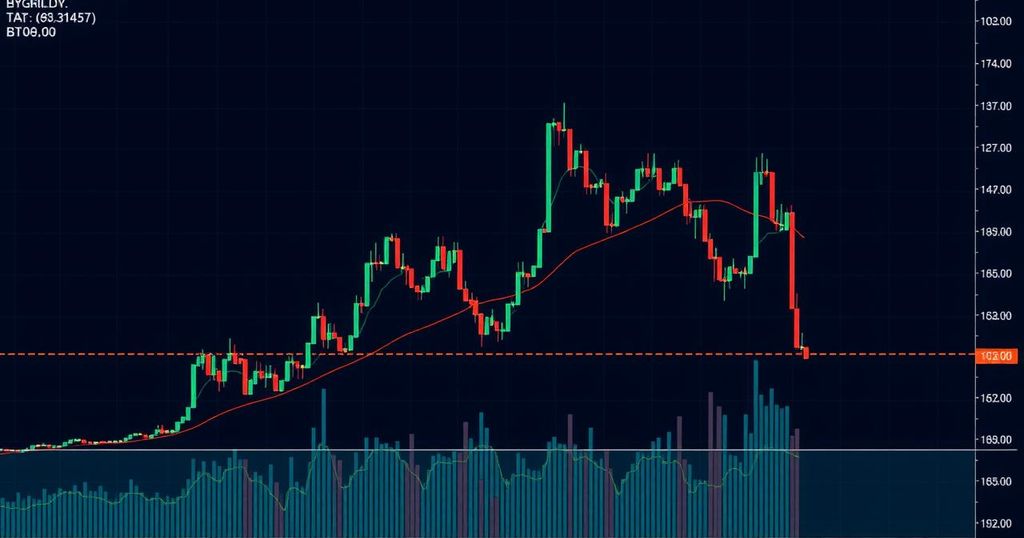
A crypto analyst, sharing insights on X, pointed out that Bitcoin is indeed establishing a descending triangle on its daily candlestick chart. This pattern, according to technical analysis principles, is commonly associated with bearish breakouts. As evidenced in the accompanying chart, Bitcoin faced repeated rejections from a downward-sloping trendline, first established after reaching an all-time high of $111,814 on May 22. The price subsequently saw another rejection just shy of $110,000 this week. Meanwhile, the triangle’s base has exhibited stability, maintaining support around $102,000.
The analyst also highlighted the significant roles played by the 21-day moving average, painted in blue and acting as resistance, and the 50-day moving average in green, serving as temporary support. As the price movement continues to contract within this triangle, the market is poised for a decisive breakout or breakdown. The direction it takes could set the tone for Bitcoin’s next major trend, with a downside breakout appearing more likely if the triangle pattern persists with lower highs and steady support.
The situation between Israel and Iran is not just a political concern; it could have repercussions for Bitcoin’s price action as well. Notably, the recent airstrike by Israel on Iran generated significant liquidations across the crypto sector, highlighting how geopolitical events can influence trading behaviour. Subject to these conditions, the leading cryptocurrency could either be viewed as a safe haven or face sell-offs for liquidity.
If fear continues to grip traditional markets, there’s a strong chance Bitcoin could breach the $102,000 support in the coming days, lending credence to the bearish nature of the descending triangle. Conversely, should there be a return of bullish momentum, a break above the descending trendline would nullify the bearish implications and potentially bring the $110,800 all-time high region back into play. As of now, Bitcoin is trading around $104,990, leaving traders on edge to see what happens next.


Post Comment