Understanding the Recent Decline in Ethereum Price and Future Outlook
Ethereum (ETH) has seen a decline of over 6% recently, primarily due to unfavorable US inflation data. The core PCE index increased, requiring potentially higher interest rates, which adversely affects cryptocurrency values. Technical patterns indicate further risks for ETH, with a forecasted drop possibility to $1,537 unless it breaks resistance at $2,131.
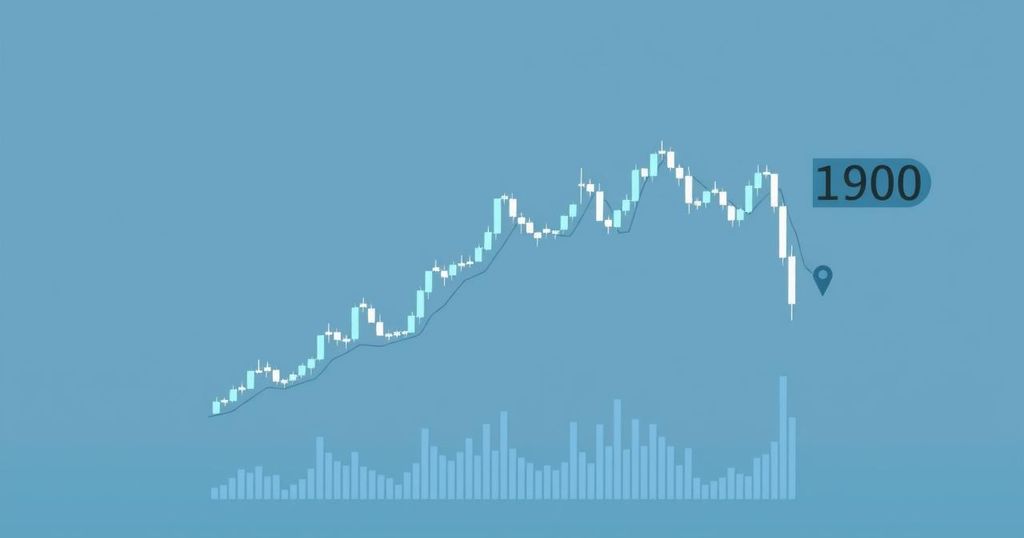
On Friday, Ethereum (ETH) suffered a significant decline of over 6%, marking a persistent downward trend initiated on March 24, when it briefly peaked at $2,105. Following this, the price fell to a low of $1,880, the lowest since March 18, thus erasing nearly all of its recent gains.
This price drop can be attributed largely to newly released US inflation data, which indicated a rise in the core Personal Consumption Expenditure Index from 2.7% in January to 2.8% in February, while the headline PCE climbed to 2.5%, surpassing the Federal Reserve’s target of 2.0%. These figures suggest sustained inflation, especially in light of upcoming tariffs following Donald Trump’s announcement, raising concerns that higher interest rates will persist.
In reaction to these economic indicators, traditional markets also saw declines, with the S&P 500 falling by 1.5%, and the Nasdaq 100 and Dow Jones Index suffering declines of 2% and 1.2%, respectively. Other cryptocurrencies such as Bitcoin (BTC) and Cardano (ADA) similarly experienced downward pressure.
The fear and greed index, which dropped to 25, indicates heightened anxiety among investors ahead of Trump’s tariffs. Economists have warned that such tariffs could potentially trigger a recession, undermining some of the growth achieved during Joe Biden’s administration.
Moreover, Wall Street investors have been hesitant, reflected in data from SoSoValue indicating that spot Ethereum ETFs only saw inflows once in March, adding $14.8 million in net assets on March 4 but subsequently losing funds, diminishing cumulative assets to $2.4 billion. Overall, total assets across Ethereum ETFs rest at $6.86 billion.
From a technical standpoint, Ethereum’s price decline can also be described by various patterns. The weekly chart indicates a triple-top pattern forming at $4,000 with a neckline located at $2,130, marking its lowest point since August of last year. After breaching this neckline, Ethereum subsequently retested it, suggesting a continuation pattern could be forming, specifically a bearish flag.
Given these circumstances, the potential exists for Ethereum to drop to $1,537, which aligns with its lowest point recorded on October 9. Conversely, a breakout above the significant resistance level of $2,131 would negate the current bearish sentiment.


Post Comment