Bitcoin Price Analysis: Assessing Rebound vs. Reversal Trends
Bitcoin’s price is poised at $84,068, showing mixed chart signals. Daily trends suggest potential bullish reversals, with key supports at $82,000-$83,000. However, the four-hour chart indicates bearish momentum and low conviction in rebounds. Oscillators give a neutral reading, while moving averages highlight a conflict between short-term bullishness and long-term bearish signals, indicating cautious trading ahead.
On April 20, 2025, Bitcoin’s price stood at $84,068, accompanied by a market cap of $1.66 trillion and a 24-hour trading volume of $12.23 billion. The intraday price fluctuated between $84,037 and $85,470, indicating a volatile trading environment.
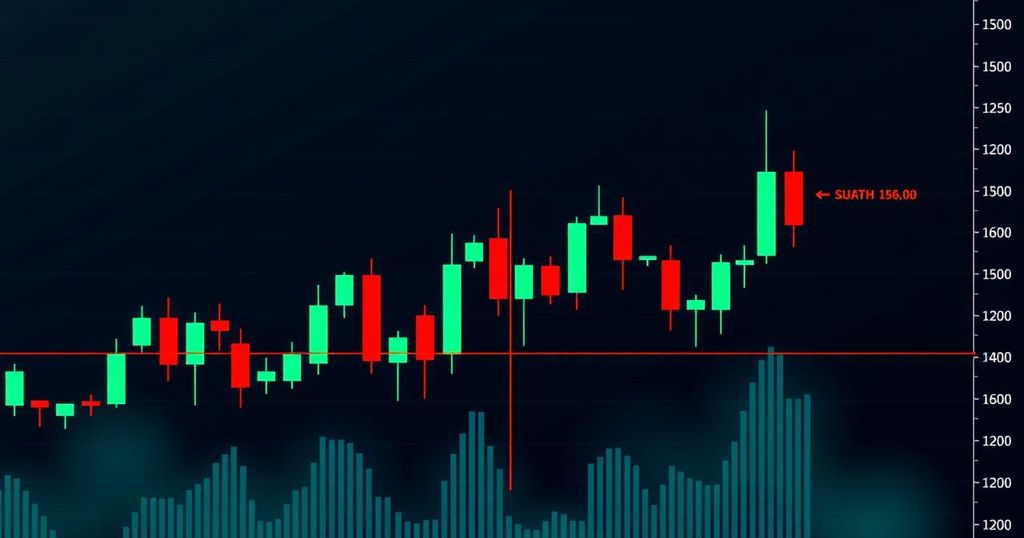
The daily chart exhibits a potential bullish reversal as Bitcoin rebounded from a low of $74,434 to nearly $85,000. A succession of green candles, coupled with increased trading volume near lows, suggests buyers are returning. Notably, key support is identified between $82,000 and $83,000, which traders may utilise for swing trading if a pullback occurs. Resistance remains persistent between $87,500 and $88,000, a level that previously halted price rallies and may attract profit-taking.
On the four-hour chart, there are signs of developing bearish momentum, characterised by lower highs and multiple red candles that imply possible continuation of downside pressure. A recent bounce at $83,102 lacks conviction. Without an increase in buying volume, Bitcoin may retest the $83,000 support level; a break below could target further drops to $81,000 or $80,000. Conversely, if support holds, a rebound towards $85,000 could occur, though within a weakening trend.
The one-hour chart indicates a descending price pattern, marked by consistent lower highs, suggesting ongoing selling pressure. A slight bounce at $83,974, fueled by low volume, does not confirm a strong reversal. Scalpers might consider short positions between $84,500 and $85,000, using tight stops above $85,600 and targeting around $83,500 if bearish momentum is validated.
Oscillator readings reveal a mixed technical picture, with indicators such as RSI, Stochastic, CCI, and ADX indicating neutrality, reflecting momentum indecision. Nevertheless, the momentum indicator and MACD are signalling bullish momentum, suggesting some underlying positive energy despite prevalent uncertainty.
Moving averages present a complex analysis where short-term EMAs and SMAs are generally supportive, while longer-term averages indicate bearish trends. The 10, 20, and 30-period EMAs and 20, 30-period SMAs signal strength; however, all moving averages from the 50-period onwards, including the 100 and 200-period, remain bearish. Such divergence highlights a pivotal point where short-term positivity confronts long-term resistance, necessitating careful momentum assessment for traders.
Bullish outlook: Should the $82,000-$83,000 support area persist in attracting buying and momentum indicators remain stable, Bitcoin could advance towards $87,000-$88,000. Despite long-term moving averages leaning bearish, short-term recovery and positive momentum signals provide bulls with a tactical advantage.
Bearish outlook: Although Bitcoin sustains above the $84,000 level, it faces pressures from slumping intraday momentum and weakening bounce structures, with a majority of longer-term moving averages suggesting sell signals. Without a decisive break above $85,500 combined with robust volume, a bearish trajectory towards $81,000 appears more likely in the near term.


Post Comment