Ethereum Price Analysis: Consolidation Below Key Resistances and Supports
Ethereum’s price has experienced a retracement after failing to overcome the $1,650 zone, now trading below $1,600. The currency is consolidating near support levels, particularly at $1,565, while the resistance at $1,620 remains critical. Failure to overcome this resistance may lead to further declines targeting $1,550 and below. Technical indicators suggest bearish momentum persists.
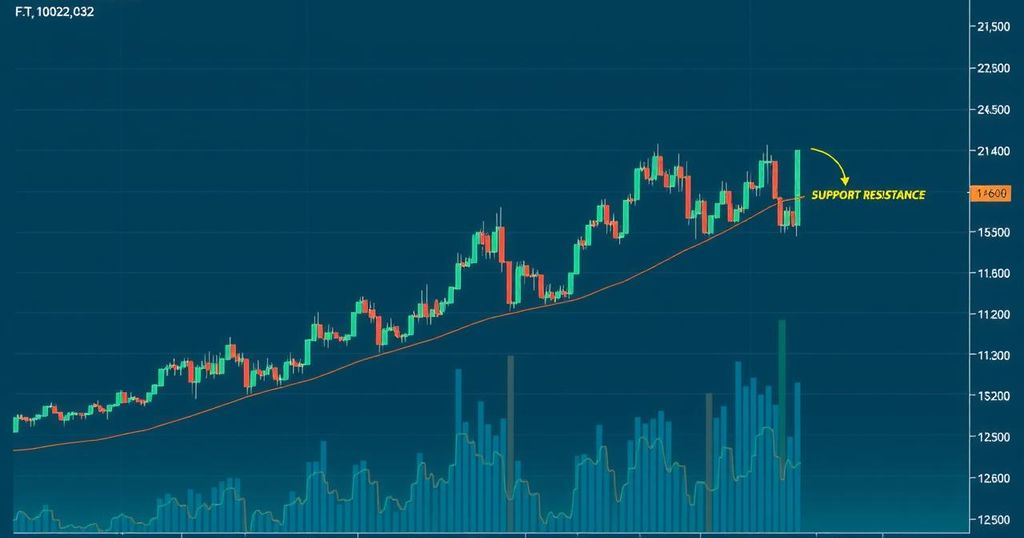
Ethereum’s price action showcases a temporary loss of momentum after failing to surpass the $1,650 mark, leading to a corrective phase. Currently, ETH is consolidating below the $1,600 threshold and the 100-hourly Simple Moving Average, indicating a bearish reaction initiated from the aforementioned zone. The hourly chart reveals a break below a short-term contracting triangle with a key support level set at $1,595 for the ETH/USD pair.
Despite recent bearish trends, Ethereum remains positioned above the $1,520 level, having previously risen above $1,600 and $1,620. However, the price retreated after forming a high at $1,655 and subsequently fell below the $1,600 mark. A dip tested the $1,565 zone, forming a low at $1,564 and now consolidating. Currently, the price sits beneath the 23.6% Fibonacci retracement level for the drop from $1,655 to $1,564.
As it stands, Ethereum’s price is facing resistance near the $1,600 mark with pivotal levels at $1,610 and the 50% Fibonacci retracement level emerging as barriers. The primary resistance to watch is at $1,620; a breach above this could propel prices toward $1,650, potentially signalling a bullish trend that may lead towards resistance levels at $1,720 or even $1,800 in the near future.
Conversely, should Ethereum be unable to overcome the $1,620 resistance, it risks initiating further declines. Initial support is anticipated around the $1,565 level, with a significant support area at $1,550. If the price breaches this support, it could further decline towards $1,500 and subsequently $1,450, with key support at $1,420.
Technical analysis indicates that the hourly MACD for ETH/USD is gaining bearish momentum, while the Relative Strength Index (RSI) has shifted below the 50 zone, further confirming bearish sentiment for Ethereum’s price action.


Post Comment