Ethereum Price Analysis: Current Bearish Trends and Future Outlook
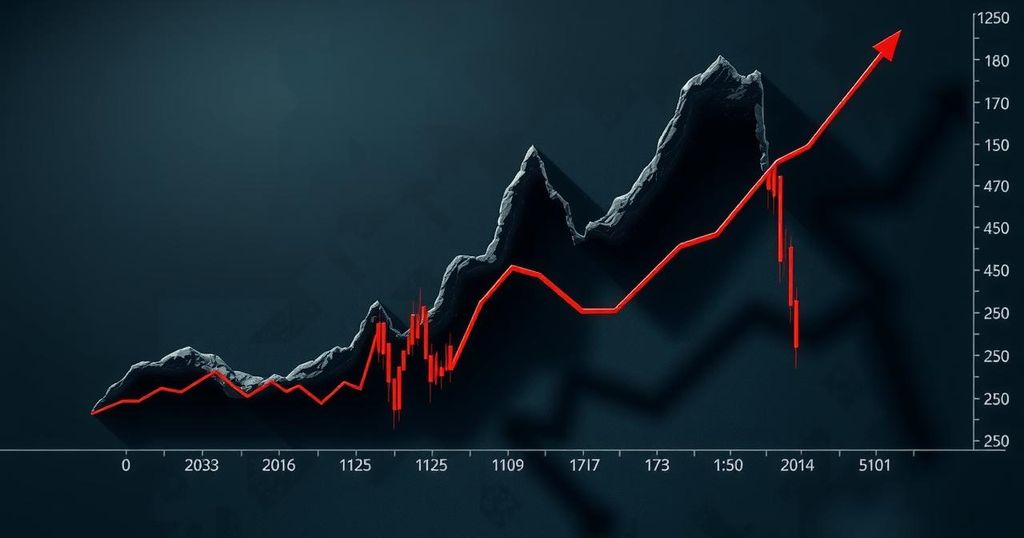
Ethereum (ETH) has dipped to $1,500, seeing a 561% surge in trading volumes, resulting in significant liquidations. The current market conditions reveal extreme fear, as ETH’s year-to-date losses reach 55.3%. Momentum indicators suggest continued bearish trends, although historical patterns indicate potential rebounds. Traders should exercise caution around critical Fibonacci levels.
Ethereum (ETH) has recently hit a bearish target of $1,500 amidst a significant increase in trading volumes, which soared 561% to $44.6 billion. This surge in trading accounts for roughly 25% of ETH’s circulating supply. Notably, $1.2 billion in long positions across the crypto market have been liquidated, with ETH constituting about one-third of this total loss, positioning it as a notable underperformer among the top ten cryptocurrencies.
Over the weekend, Ethereum’s year-to-date losses reached approximately 55.3%, exceeding Solana’s losses by nearly 9% and BNB’s decline by about 33%. Its dominant presence in the DeFi space makes the token particularly vulnerable during market downturns, as it is commonly used as collateral for leveraged trades, accelerating liquidations once certain price thresholds are breached. Data from DeFi Llama suggests that a further 9% drop could lead to an additional liquidation of almost $70 million worth of ETH, potentially exerting downward pressure on prices.
As predicted in a previous analysis, a break below the $1,750 level prompted a substantial drop in ETH’s price over the weekend, coinciding with heightened market panic. The Fear and Greed Index has plummeted to a low of 17, indicating extreme fear among investors. After dipping near $1,400 during the Asian session, ETH has since climbed above the $1,550 support level.
Currently, momentum indicators suggest bearish trends, as reflected by the MACD histogram showing two dark red bars, hinting that the bearish movement may have just commenced. The Relative Strength Index (RSI) has fallen into oversold conditions, signalling the rapid change in price trends but not necessarily indicating a price reversal.
Historically, ETH has typically bounced back after the RSI exited oversold levels. However, caution is advised since only one of the previous three instances saw a successful recovery above the 30 RSI marker, where ETH subsequently rose from around $1,500 to $4,000 over six months.
Reviewing the hourly chart, ETH rebounded from $1,410 but faced substantial selling pressure near the 61.8% Fibonacci retracement level. With short-sellers anticipating further drops, there exists a risk of a liquidity trap that could allow bulls to restore momentum up to the $1,750 resistance area. Traders are advised to wait for a retest or a breach of the Fibonacci level to avoid being ensnared in what appears to be an impending liquidity trap. Should selling pressure resume, a pronounced downward candle could occur upon retesting these levels.


Post Comment